GraphVar version 2.03 has been released.
NEW: Video Tutorials available on the GraphVar Youtube Channel
Please cite this toolbox as:
Kruschwitz JD, List D, Waller L, Rubinov M, Walter H - GraphVar: A user-friendly toolbox for comprehensive graph analyses of functional brain connectivity, JNeuroscience Methods (2015),
http://dx.doi.org/10.1016/j.jneumeth.2015.02.021
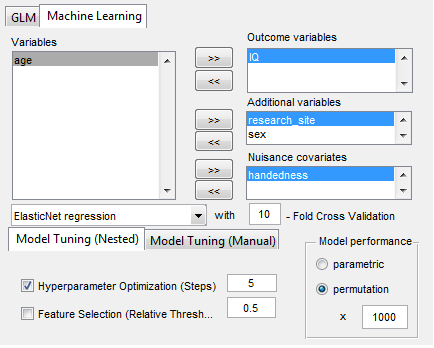
Waller L, Brovkin A, Dorfschmidt L, Bzdok D, Walter H, Kruschwitz JD - GraphVar 2.0: A user-friendly toolbox for machine learning on of functional connectivity measures, JNeuroscience Methods (2018),
https://doi.org/10.1016/j.jneumeth.2018.07.001
New release: GraphVar 2.03: DOWNLOAD HERE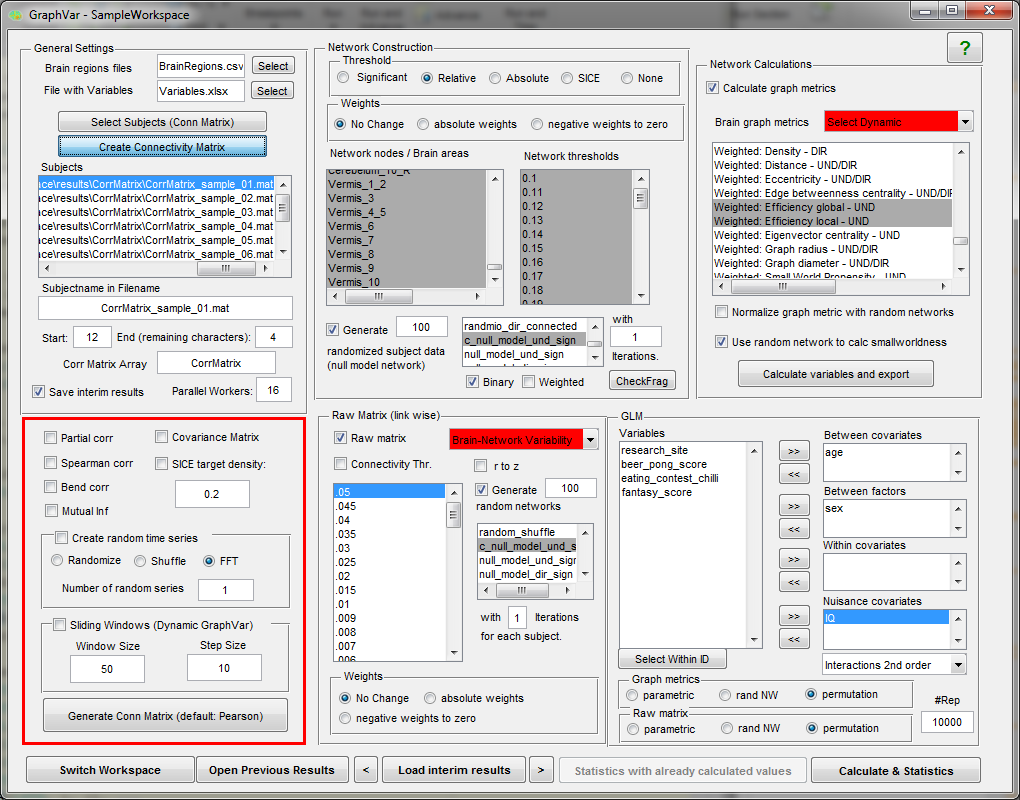
DOWNLOAD - GraphVar:
www.nitrc.org/projects/graphvar
New Release: GraphVar 2.03
Download miscellaneous:
Video Course:
Introduction to Brain Network Analysis (Youtube Channel)
Paper:
Article in "Journal of Neuroscience Methods 2015"
Article in "Journal of Neuroscience Methods 2018"
New Feature Highlights:
New Features GraphVar 2.02
New Features GraphVar 1.02
New Features GraphVar 0.62.png)
Quick Guide:
QuickGuide_GraphVar
Tutorials:
Tutorial_GraphVar
DynamicGraphVar_Tutorial
Manual:
Manual_GraphVar
Original Poster:
OHBM_Poster_GraphVar
Features and Highlights:
“GraphVar” is a user-friendly graphical-user-interface (GUI)-based toolbox (MATLAB) for comprehensive graph-theoretical analyses of brain connectivity, including network construction and characterization, statistical analysis (GLM and machine learning) on network topological measures, and interactive exploration of results. By combining together features across multiple current toolboxes, such as the Brain Connectivity Toolbox, the Graph Analysis Toolbox, the Network Based Statistic Toolbox, BrainNetClass and BRAPH (BCT, Rubinov and Sporns 2010; GAT, Hosseini et al., 2012; NBS, Zalesky et al., 2010; BrainNetClass, Zhou et al., 2020; BRAPH, Mijalkov et al., 2017), GraphVar represents a comprehensive collection of graph analysis routines for functional neuroimaging researchers. GraphVar offers an interactive viewer that allows intuitive exploration of statistical results. Results can easily be exported and reloaded.
The program entails a detailed manual that includes usage instructions and a description of all the implemented functions, a Quick Guide for getting started, and a tutorial for getting started with sample data.
(GraphVar was developed by J.D. Kruschwitz*, D. List*, L. Waller, M. Rubinov, H. Walter and is provided under the GNU GPL v3; *equal contribution)
.png)
1. Highlights:
- GraphVar does not require MATLAB programming experience
- GraphVar contains most functions included in the Brain Connectivity Toolbox, but allows users to add custom functions which can subsequently be accessed via
the GUI.
- GraphVar accepts correlation matrices as input but can also generate correlation or partial correlation matrices, offers generation of connectivity matrices based on percentage bend correlations, spearman correlation and mutual information from input time series. (e.g. ROISignals_TC from the DPARSF output). Additionally GraphVar generates covariance matrices that may be used for estimating binary graphs with the sparse inverse covariance matrix option (SICE).
- Users may also provide demographic, clinical and other subject specific data (in spreadsheet format) for statistical analyses.
- GraphVar offers pipeline construction of graph networks with a choice of no, relative, absolute and significance-based thresholding, and the generation of
subject specific “null-model networks and sub-network analyses”.
- Binary and weighted network topological measures can be easily calculated, normalized, exported, and used in statistical analyses.
- Statistical analyses include general linear models (GLM and Machine Learning) with the network measures but also on the raw connectivity matrices (i.e., network based statistics including identification of graph components).
- Statistical tests can be performed in a parametric and non-parametric fashion (i.e., testing against null-model networks, non-parametric permutation testing).
- GraphVar now supports Sliding Window analyses on the raw matrices but also with the graph topological measures!
2. Release notes:
Release info GraphVar 2.02:
Release info GraphVar 2.0:
Release info GraphVar 1.03:
We found that in the GraphVar 1.0 update, the function to calculate the clustering coefficient
for binary undirected graphs was accidentally replaced with a function to calculate the number of
triangles around each node. The clustering coefficient, however, is defined as the number of triangles
around each node divided by the number of possible triangles. In other words, the values that were
returned are simply the unscaled form of the binary undirected clustering coefficient.
The functions for calculating the clustering coefficient on weighted network (clustering_coef_wu; clustering_coef_wd)
and the binary clustering coefficient fpr directed networks (clustering_coef_bd) were not affected.
However, even though the values are thus conceptually related, the number of triangles and the
actual clustering coefficient share only roughly 20% of their variance. Therefore, please
re-run your analyses if you have used the clustering coefficient for binary undirected graphs
with a GraphVar version 1.00, 1.01, or 1.02.
GraphVar 1.03 now entails the original BCT clustering coefficient
function for binary undirected networks (clustering_coef_bu.m)
We are very sorry for the inconvenience!
Release info GraphVar 1.02:
1. Fixed a bug where the direction of the effect of continuous by continous
interactions was reversed in some models. This issue did not affect the
p-values of the regressors.
Release info GraphVar 1.01:
1. display mouseover non-parametric p-vals in one-dimensional graph metrics
2. enable the export of non-paramtric p-val maps from results viewer (previously only parametric p-vals were exported)
3. fixed a bug for drawing graphs in the network inspector for non-parametric p-vals<.0000001
Release info GraphVar 1.0:
1. New general linear model (GLM) framework for statistical analyses
2. Fast permutation testing via C functions
3. C++ implementation of „null_model_und_sign“ (ten times faster than the original BCT version)
4. New dynamic graph measure: Brain-Network Variability (Zhang et al. 2016)
5. Optimized results viewer
Release info GraphVar_beta_v_0.62:
1. Added two NEW "dynamic" graph measures!
- nodal flexibility and nodal promiscuity coefficient which are based on changing community assignments in an ordered multislice matrix (as in Braun et al., 2015: Dynamic reconfiguration of frontal brain networks during
executive cognition in humans)
2. Added new "regular" graph metrics:
- global cost-efficiency (as in Bassett et al.,2009): Cognitive fitness of cost-efficient brain functional networks, PNAS.
- small-world propensity (unbiased assessment of small-world structure in networks of varying densities) -> developed by Muldoon, Bridgeford and Bassett (http://arxiv.org/abs/1505.02194)
3. Finally, you can do directed analyses (graph metrics and raw matrix calculations) if you input e.g. directed granger causality matrices!
4. Added "CheckFrag": will check if network fragmentation with respect to the settings in your network construction occur
5. GraphVar now saves more output files when doing sliding window analyses (not only the dynamic summary measure as before) and will also save all results when only "calculate and Export" for further usage.
Files in your interim results folder are now (depending on what computations you do here with clustering_coeff as example):
- clustering_coef_bu_4.9_1.mat: dynamic summary measure (e.g. variance) of clustering_coef_bu across windows for each node on threshold 0.49 for all subjects
- clustering_coef_bu_4.9_1per_SW.mat: the (normalized) clustering_coef_bu for each node in each of the sliding windows on threshold 0.49 for all subjects
- clustering_coef_bu_4.9_1-rand1.mat: dynamic summary measure (e.g. variance) of clustering_coef_bu across windows for each node in the first random network on threshold 0.49 for all subjects
- clustering_coef_bu_4.9_1-rand_per_SW.mat: the clustering_coef_bu for each node in each random network in each of the sliding windows on threshold 0.49 for all subjects (i.e., cell comprised of: subjects x random networks x sliding windows)
6. Changed the normalization procedure for dynamic summary measures (this does not include "nodal flexibility/promiscuity":
- OLD normalization procedure: the dynamic summary measure of the orig. data was devided by the mean of the dynamic summary measure of the random data (there was a lot of information loss)
- NOW: first, per sliding window graph metrics are normalized as usual by division of the mean of the same graph metric derived in random networks in the same sliding window. Second, the dynamic summary measure is calculated across sliding windows of the beforehand normalized graph metrics.
Release info GraphVar_beta_v_06.12:
Again some bug fixes for "dynamic" calculations (THANKS to XIAOSONG HE for noticing these errors!)
- added the exception that for sliding windows also non-overlapping windows can be generated with gaps between windows
- fixed a bug that when generating sliding windows the last possible window was omitted from generating
- fixed a bug that the window size was erroneous window size+1
- fixed a bug that a cell2mat error occured for variance/standard deviation calculations with small-worldness (sliding windows)
Release info GraphVar_beta_v_06.11:
Mainly some small bug fixes that occured when using "static" matrices in "dynamic" GraphVar
- getMeanMatrix: corrected that plotting of MeanMatrix did not work when calculated without sliding windows (i.e., static matrix).
- Results: fixed a bug for plotting single subject matrices generated from time courses when no sliding windows were generated beforehand (i.e. static matrices).
- NetworkInspector: fixed a bug that "GetComponent" did not work when not generating random data but using parametric p-vals for initial link thresholds
- CalcVars: bugfix, that if individually generated "corr matrix" arrays were used (and not named "...Matrix") GraphVar stopped calculating when testing against random networks and using raw matrices.
Release info GraphVar_beta_v_06:
This Version offers some possibilities for Dynamic Functional Connectivity and Dynamic Graph Analyses -> DynamicGraphVar! Please read this for detailed info: DynamicGraphVar_Tutorial
Release info GraphVar_beta_v_05.1:
This release contains a bugfix that if numbers (e.g. 0 1) were used instead of strings (e.g. "male" "female") for defining groups (strings were suggested in the default variable sheet) group assignment mismatches could occure.
Release info GraphVar_beta_v_05.0:
- Create Connectivity Matrix:
- generate covariance matrices from input time series
- use SICE to produce binary graphs with a desired density from input time series
- features an additional method for producing random time series: randomizing the observed time series by taking its Fourier transform, scrambling its phase and then inverting the transform (Prichard, D., & Theiler, J. ;1994) - Network Construction:
- use SICE (sparse inverse covariance estimation) to estimate binary graphs across a desired density range
Release info GraphVar_beta_v_04.2:
- Statistical Analyses:
- included paired sample T-Test - e.g. for examining pre-post treatment effects (works for graph metrics, raw matrix, network based statistics)
Release info GraphVar_beta_v_04.0:
- Create Connectivity Matrix:
- Acceleration of connectivity matrix generation (achieved through vectorization) - Network Construction:
- Calculate and export graph topological measures now also without applying thresholds (i.e., on the fully connected matrix)
- Modify weights in the matrices by using “absolute weights” or “negative weights to zero” - Network Calculations
- GraphVar will warn you at the densities were negative weights will enter your calculations
- Inclusion of “Rich Club Coefficient” (please ignore the node labels in the export -> each column stands for level k) - Statistics
- Inclusion of non-parametric testing on the metric level for correlational analysis (i.e., testing against shuffled data) - Results Viewer
- plot single subject association matrices (e.g. for QC)
- plot mean connectivity matrices (i.e., connectivity across subjects) to determine the direction of your effects in more detail - Network Inspector
- open your identified graph component immediately in BrainNetViewer for 3D visualization (BrainNetViewer must be added to Matlab with subfolders)
Release info GraphVar_beta_v_03.2:
This release contains a bugfix (erroneous convertion of connection weights into connection-length weights) that impacted the calculation of the following WEIGHTED measures (binary was not affected): local char pathlength, global char pathlength, edge betweenness centrality, node betweenness centrality, small worldness
Release info GraphVar_beta_v_03.1:
This release offers more possibilities to generate connectivity matrices from time courses: besides pearson correlation and partial correlation, GraphVar now also enables creation of connectivity matrices based on percentage bend correlations, spearman correlation and mutual information - enjoy!
Release info GraphVar_beta_v_03:
Supports parallel computing! If you installed the MATLAB parallel computing toolbox, you can set the number of "Parallel Workers", GraphVar will distribute the subjects (generation of correlation matrices and random networks) into different CPU cores.
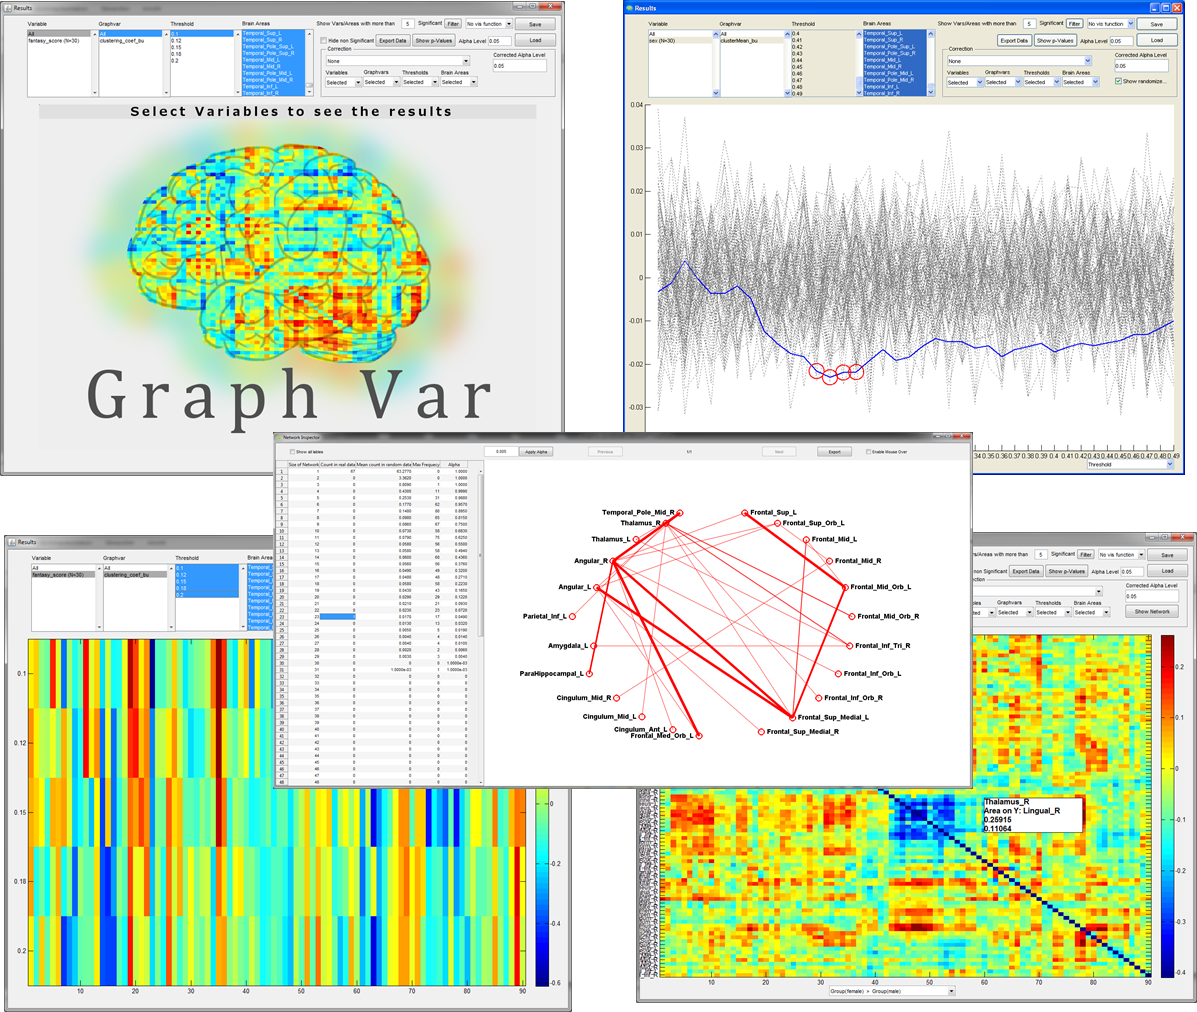
EXAMPLE OUTPUT of the Interactive RESULTS VIEWER:
Thank you for your reply. i
Thank you for your reply. i update my GraphVar to 1.03. there is no previous error, but a new error occured that when pressing calculate variables and export, the error is occuring. I don't know what's happend? Can you help me again?
update your MATLAB version
Hey,
the error you report occurs as you are using an old MATLAB version that does not support our interactive waitbar. Please update your MATLAB to 2014 or above.
Best,
Johann
Matlab2017
Hi,
actually the programm should detect which Matlab version you are using and switch to the respective commands for enabling parallel computing.
Maybe the version identifier also changed with Matlab 2017 ... I will check this if I have time available and rewrite the script (I dont have updated to 2017 yet).
From your error post it seems as if you have the parallel computing toolbox. So to solve this quickly, you could uncomment lines 14 - 24 in the script "isParallel.m" under GraphVar-1.03\src\calc. Another (not preferable) option would be to deinstall the parallel computing toolbox.
Please let me know if this works.
Best,
Johann
Re: [RFMRI] GraphVar - a user
GraphVar and structural data
Hi Johann,
First of all, thank you for your effort to provide a GUI-based toolbox for people with poor scripting abilities like me.
I found a previous comment (dating about 2 years ago) saying that GraphVar can be used for structural data too, but that creation of connectivity matrices relies on other software, as GraphVar has been developed for functional data.
Indeed, I was interested in using GraphVar on DTI and cortical data extracted by Freesurfer. I was wondering if the most recent version of the software now allows to process structural data from the beginning to the end or if connectivity matrices still require other software. In the latter case, have you got any suggestion to extract them in an easy way?
Best regards,
Stefano
Structural Data
Hi,
thanks for using GrapVar! Unfortunatelly, the main focus still is on creation of conn matrices with functional data. Therefore, I repost my previous answer here:
You can very well use GraphVar for graph theoretic analyses of structural connectivity data. However, the GraphVar “generate conn matrix” function is specifically written for generating connectivity matrices (nxn matrix) from time series data. Thus, you cannot use GraphVar for generating nxn matrices from structural data. Best would be that you use some other program (e.g. DoDTI or ExploreDTI) to construct a structural connectivity matrix (e.g. a matrix capturing the amount of fiber tracts from region to region) that you subsequently load into GraphVar (for GraphVar the kind of matrix does not really matter as long as it is a symmetric nxn matrix). Once you have defined your nxn matrices you can make use of all the graph theoretic functions in GraphVar.
I know that ExploreDTI (http://www.exploredti.com/) has some specific output functions that allow exporting various nxn matrices that can be used for graph theoretic analysis (e.g in GraphVar). Alternatively I think that Mnet (http://neuroimage.yonsei.ac.kr/mnet/) or GAT (http://www.plosone.org/article/info%3Adoi%2F10.1371%2Fjournal.pone.0040709) specifically entail pipelines for graph theoretical analysis of structural data.
I hope this helps,
Johann
Hi Johann,
Hi Johann,
Thank you for the clarifications!
All the best,
Stefano
Errors in GraphVar
Hello, Johann and the GraphVar team
When I run the GraphVar in my MATLAB, it showed up those errors in my command window:
I used the old version (beta_v_06.2) and tried to use the latest version (v_1.03), but it didn't work.
Please help me! Thanks for your help!
Best regards,
SHS
compatibility issue
Hi,
please remove the old GraphVar version from your Matlab path (i.e., the new version calls some old version of some scripts which have the same name). This should solve the problem.
Best,
Johann
Thanks for your help
Hello,
Oh, I got the answer!
When GraphVar conducted under the Matlab version above 2012, it can work.
Thanks!
GraphVar Error - Question
Hello and Thank you for this amazing tool and support!
I recently installed GraphVar on my Linux machine and was working through the sample data when it crashed halfway through the last stage of modeling. I’ve tried to track down this error, uninstalled and reinstalled the program, tried different versions and I continue to get the following:
Invalid MEX-file '/home/k/ksd770/Desktop/MATLAB/GraphVar_2.01/src/calc/tfun/tpinv.mexa64': /lib64/libc.so.6: version `GLIBC_2.14' not found (required by
/home/k/ksd770/Desktop/MATLAB/GraphVar_2.01/src/calc/tfun/tpinv.mexa64)
Error in graphvar_glm (line 494)
LXTXL = tpinv(tdot(tdot(L, XTX), tt(L)));
Error in executeStats (line 132)
[PFUN, RFUN, NFUN, ...
Error in GraphVar_corr (line 86)
[Files, LAB, N] = executeStats(allTasks, ...
Error in GraphVar>Btn_calcCorr_Callback (line 75)
GraphVar_corr(handles,allTask)
Error in gui_mainfcn (line 96)
feval(varargin{:});
Error in GraphVar (line 40)
gui_mainfcn(gui_State, varargin{:});
Error in @(hObject,eventdata)GraphVar('Btn_calcCorr_Callback',hObject,eventdata,guidata(hObject))
Error while evaluating uicontrol Callback
I'm new to GraphVar and would appreciate any advice or insight!
Blank threshold results box
Hello,
I would very much appreciate some guidance on a (hopefully quick fix!) error I have encountered: regardless of whether I use my own data or the provided sample data, the 'Threshold' box is blank on the Results Viewer (despite having selected thresholds in the 'Network thresholds' and 'Connectivity Thr.' boxes). I originally thought the issue might be with my version of Matlab (2016b), so I updated the program to 2018a and still encounter the error.
Additionally, Matlab shows the following error:
Any thoughts you have on how to fix this error would be much appreciated!
Thank you in advance for your help,
Rachel
empty threshold box
Hi,
from the error it seems as if the programm does not find the path to the matrix with the p-values that indicate the threshold that you select. Thus, the box is empty. You will have to select the array of reference values as in described in the manual under "4.4. Connectivity Thr.).
I had the experience that this error occurs on linux sysrtems more often and not under windows.
Best,
Johann
Results Viewer Errors
Hello,
I apologize if this is a duplicate message - despite refreshing my browser window my comment is not showing up on my screen. If it is a duplicate, please disregard.
I would greatly appreciate any insight you might have into the following error: after running through the GraphVar GUI apparently successfully and going to the Results Viewer, there are no thresholds to select in the corresponding box. This occurs both with my own data and the provided sample data.
Additionally, when I click on any of the variables in the Variables box in the Results Viewer, the following error arises:
Index exceeds array bounds.
Error in Results_PlotView (line 106)
filterFieldStrings{3} = handles.thresholds(thresh);
Error in Results>L_Var_Callback (line 299)
Results_PlotView(hObject, handles)
Error in gui_mainfcn (line 95)
feval(varargin{:});
Error in Results (line 34)
gui_mainfcn(gui_State, varargin{:});
Error in
matlab.graphics.internal.figfile.FigFile/read>@(hObject,eventdata)Results('L_Var_Callback',hObject,eventdata,guidata(hObject))
Error while evaluating UIControl Callback.
And a similar error comes up when I click on the contents of the Graphvar box:
Index exceeds array bounds.
Error in Results_PlotView (line 106)
filterFieldStrings{3} = handles.thresholds(thresh);
Error in Results>L_Graph_Callback (line 301)
Results_PlotView(hObject, handles)
Error in gui_mainfcn (line 95)
feval(varargin{:});
Error in Results (line 34)
gui_mainfcn(gui_State, varargin{:});
Error in
matlab.graphics.internal.figfile.FigFile/read>@(hObject,eventdata)Results('L_Graph_Callback',hObject,eventdata,guidata(hObject))
Error while evaluating UIControl Callback.
I am using Matlab2018a (I tried it also with Matlab2016b), and GraphVar 1.03.
Any thoughts you have on this issue would be greatly appreciated!
Rachel
empty threshold box
Hi Rachel,
I would suggest updating to a newer GraphVar version above 1.03. I just checked and there was indeed a bug in the older versions occuring on Linux and Mac systems (windows unaffected) that could lead to an error when GraphVar tried to retrieve the selected thesholds from the GUI.
I think that we corrected this already in GraphVar 2.0. If the error still persists in a newer version please let me know. Thanks!
Best,
Johann
Now working!
Hi Johann,
Thanks so much for your quick response!
I updated to the most recent GraphVar version (2.01b) and it appears to be working!
Thanks again,
Rachel
tlstsq dgelsd error
Hi again Johann,
In trying to run a GLM on my data, I encountered the following error:
tlstsq dgelsd error
Hi Rachel,
this error occurs when the GLM model cannot be fit with the data that enters the design matrix. This is rare but most likely to happen when there are some NaNs introduced somewhere in the pipeline. This can be in your input data (e.g. connectivity matrices), the variables sheet or also produced by GraphVar itself when some graph theroretical measures cannot be meaningful computed for particular individuals on the respective networks, or normalization leads to a division by zero. If you are using graph measures, you could have a look in the interim results folder and check if there are NaN graph metrics. A better way to check this, woul be to set a break point in line 514 in the GraphVar_glm script and to inspect Y for NaNs or Inf values (Y are the graph metrics and/or the connectivity matrices).
I hope this helps,
Johann
tlstsq dgelsd error
I'll give that a try - thanks!
Creating correlation matrices based on deconvolved signals
I realized that my previous comment was worded in a misrepresentative and unclear way. I will try to rephrase my question so it is clearer.
Thanks for all your support and for creating such a useful toolbox!
connectivity matrix
Hi Rachel,
GraphVar needs real time courses per node [i.e., N time points) x (N nodes)] to compute connectivity matrices. Maybe I do not fully understand your problem but how should it be possible to compute measures of statistical dependence (e.g., correlation) between brain regions if you only have one number per brain region (as you wrote: 1x(N nodes) sized matrix) instead of a vector of numbers per brain region?
Best,
Johann
FDR correction
Hi Johann,
Thanks for such a useful toolbox and for your prompt responses on this site.
I am interested in reporting False Discovery Rate (FDR) adjusted p-values for my analyses. I noticed that, in the Results Viewer, the FDR option says the following: 'FDR - correction (None not applicably) (Parametric)'. Given that it is the only option that says "None not applicably", I want to confirm that this option is functional?
I also noticed that it only provides a FDR Corrected Alpha Level for analyses on the Raw Connectivity matrix (and not the graph metrics). I can, however, get a Bonferroni corrected alpha level for all sets of analyses.
Do you have any suggestions for troubleshooting?
Thank you in advance for your help!
Graphvar does not finish when i run statistics and calculate
Error: the first subject name could not be found
Error: the first subject name could not be found
help error message
Dear GraphVar team,
Not sure whether this forum is still active, but thought I give it a shot!
First, thanks for a nice tool!
I keep on running into errors when trying to generate random networks (with the recommended c_null_model_und_sign function) and normalize graph metrics with them, regardless of which thresholding and weights options I choose in the network construction panel).
The Matlab error message can be found below.
Thanks a lot in advance for helping me solve this issue!
Best wishes,
Lukas