GraphVar version 2.03 has been released.
NEW: Video Tutorials available on the GraphVar Youtube Channel
Please cite this toolbox as:
Kruschwitz JD, List D, Waller L, Rubinov M, Walter H - GraphVar: A user-friendly toolbox for comprehensive graph analyses of functional brain connectivity, JNeuroscience Methods (2015),
http://dx.doi.org/10.1016/j.jneumeth.2015.02.021
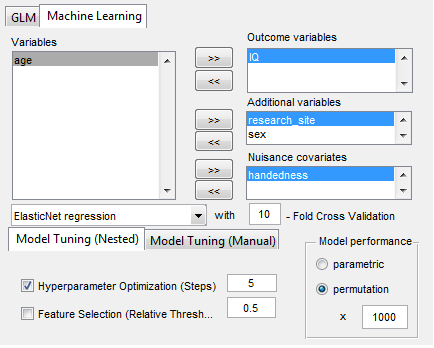
Waller L, Brovkin A, Dorfschmidt L, Bzdok D, Walter H, Kruschwitz JD - GraphVar 2.0: A user-friendly toolbox for machine learning on of functional connectivity measures, JNeuroscience Methods (2018),
https://doi.org/10.1016/j.jneumeth.2018.07.001
New release: GraphVar 2.03: DOWNLOAD HERE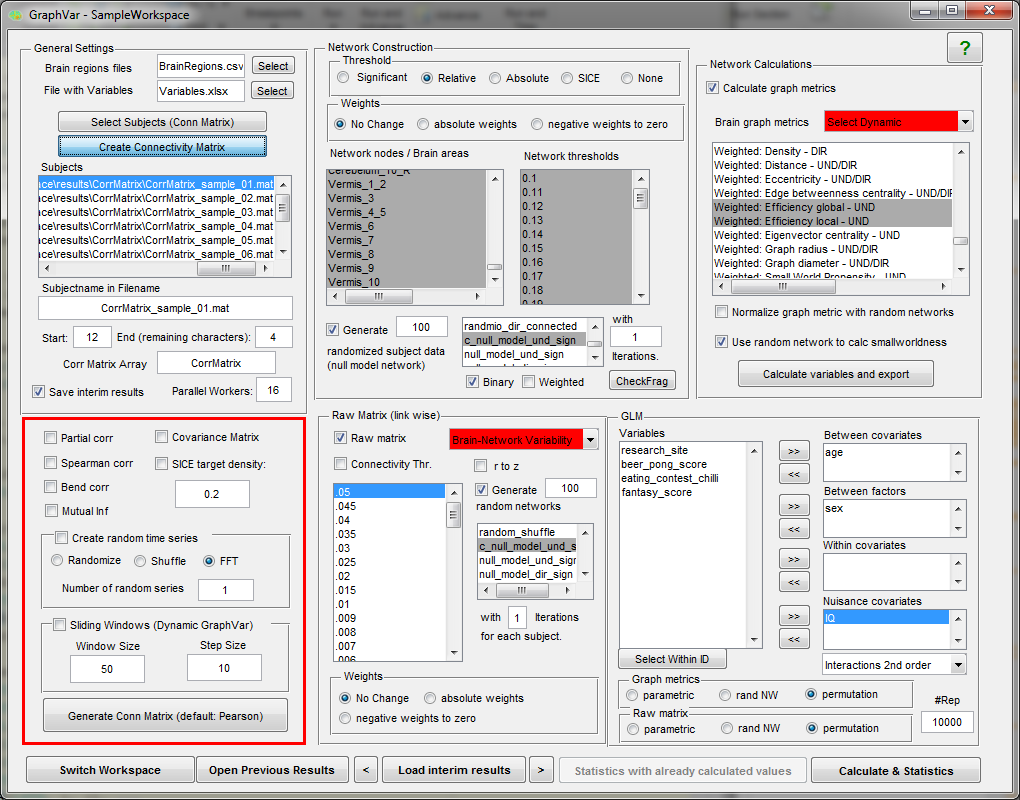
DOWNLOAD - GraphVar:
www.nitrc.org/projects/graphvar
New Release: GraphVar 2.03
Download miscellaneous:
Video Course:
Introduction to Brain Network Analysis (Youtube Channel)
Paper:
Article in "Journal of Neuroscience Methods 2015"
Article in "Journal of Neuroscience Methods 2018"
New Feature Highlights:
New Features GraphVar 2.02
New Features GraphVar 1.02
New Features GraphVar 0.62.png)
Quick Guide:
QuickGuide_GraphVar
Tutorials:
Tutorial_GraphVar
DynamicGraphVar_Tutorial
Manual:
Manual_GraphVar
Original Poster:
OHBM_Poster_GraphVar
Features and Highlights:
“GraphVar” is a user-friendly graphical-user-interface (GUI)-based toolbox (MATLAB) for comprehensive graph-theoretical analyses of brain connectivity, including network construction and characterization, statistical analysis (GLM and machine learning) on network topological measures, and interactive exploration of results. By combining together features across multiple current toolboxes, such as the Brain Connectivity Toolbox, the Graph Analysis Toolbox, the Network Based Statistic Toolbox, BrainNetClass and BRAPH (BCT, Rubinov and Sporns 2010; GAT, Hosseini et al., 2012; NBS, Zalesky et al., 2010; BrainNetClass, Zhou et al., 2020; BRAPH, Mijalkov et al., 2017), GraphVar represents a comprehensive collection of graph analysis routines for functional neuroimaging researchers. GraphVar offers an interactive viewer that allows intuitive exploration of statistical results. Results can easily be exported and reloaded.
The program entails a detailed manual that includes usage instructions and a description of all the implemented functions, a Quick Guide for getting started, and a tutorial for getting started with sample data.
(GraphVar was developed by J.D. Kruschwitz*, D. List*, L. Waller, M. Rubinov, H. Walter and is provided under the GNU GPL v3; *equal contribution)
.png)
1. Highlights:
- GraphVar does not require MATLAB programming experience
- GraphVar contains most functions included in the Brain Connectivity Toolbox, but allows users to add custom functions which can subsequently be accessed via
the GUI.
- GraphVar accepts correlation matrices as input but can also generate correlation or partial correlation matrices, offers generation of connectivity matrices based on percentage bend correlations, spearman correlation and mutual information from input time series. (e.g. ROISignals_TC from the DPARSF output). Additionally GraphVar generates covariance matrices that may be used for estimating binary graphs with the sparse inverse covariance matrix option (SICE).
- Users may also provide demographic, clinical and other subject specific data (in spreadsheet format) for statistical analyses.
- GraphVar offers pipeline construction of graph networks with a choice of no, relative, absolute and significance-based thresholding, and the generation of
subject specific “null-model networks and sub-network analyses”.
- Binary and weighted network topological measures can be easily calculated, normalized, exported, and used in statistical analyses.
- Statistical analyses include general linear models (GLM and Machine Learning) with the network measures but also on the raw connectivity matrices (i.e., network based statistics including identification of graph components).
- Statistical tests can be performed in a parametric and non-parametric fashion (i.e., testing against null-model networks, non-parametric permutation testing).
- GraphVar now supports Sliding Window analyses on the raw matrices but also with the graph topological measures!
2. Release notes:
Release info GraphVar 2.02:
Release info GraphVar 2.0:
Release info GraphVar 1.03:
We found that in the GraphVar 1.0 update, the function to calculate the clustering coefficient
for binary undirected graphs was accidentally replaced with a function to calculate the number of
triangles around each node. The clustering coefficient, however, is defined as the number of triangles
around each node divided by the number of possible triangles. In other words, the values that were
returned are simply the unscaled form of the binary undirected clustering coefficient.
The functions for calculating the clustering coefficient on weighted network (clustering_coef_wu; clustering_coef_wd)
and the binary clustering coefficient fpr directed networks (clustering_coef_bd) were not affected.
However, even though the values are thus conceptually related, the number of triangles and the
actual clustering coefficient share only roughly 20% of their variance. Therefore, please
re-run your analyses if you have used the clustering coefficient for binary undirected graphs
with a GraphVar version 1.00, 1.01, or 1.02.
GraphVar 1.03 now entails the original BCT clustering coefficient
function for binary undirected networks (clustering_coef_bu.m)
We are very sorry for the inconvenience!
Release info GraphVar 1.02:
1. Fixed a bug where the direction of the effect of continuous by continous
interactions was reversed in some models. This issue did not affect the
p-values of the regressors.
Release info GraphVar 1.01:
1. display mouseover non-parametric p-vals in one-dimensional graph metrics
2. enable the export of non-paramtric p-val maps from results viewer (previously only parametric p-vals were exported)
3. fixed a bug for drawing graphs in the network inspector for non-parametric p-vals<.0000001
Release info GraphVar 1.0:
1. New general linear model (GLM) framework for statistical analyses
2. Fast permutation testing via C functions
3. C++ implementation of „null_model_und_sign“ (ten times faster than the original BCT version)
4. New dynamic graph measure: Brain-Network Variability (Zhang et al. 2016)
5. Optimized results viewer
Release info GraphVar_beta_v_0.62:
1. Added two NEW "dynamic" graph measures!
- nodal flexibility and nodal promiscuity coefficient which are based on changing community assignments in an ordered multislice matrix (as in Braun et al., 2015: Dynamic reconfiguration of frontal brain networks during
executive cognition in humans)
2. Added new "regular" graph metrics:
- global cost-efficiency (as in Bassett et al.,2009): Cognitive fitness of cost-efficient brain functional networks, PNAS.
- small-world propensity (unbiased assessment of small-world structure in networks of varying densities) -> developed by Muldoon, Bridgeford and Bassett (http://arxiv.org/abs/1505.02194)
3. Finally, you can do directed analyses (graph metrics and raw matrix calculations) if you input e.g. directed granger causality matrices!
4. Added "CheckFrag": will check if network fragmentation with respect to the settings in your network construction occur
5. GraphVar now saves more output files when doing sliding window analyses (not only the dynamic summary measure as before) and will also save all results when only "calculate and Export" for further usage.
Files in your interim results folder are now (depending on what computations you do here with clustering_coeff as example):
- clustering_coef_bu_4.9_1.mat: dynamic summary measure (e.g. variance) of clustering_coef_bu across windows for each node on threshold 0.49 for all subjects
- clustering_coef_bu_4.9_1per_SW.mat: the (normalized) clustering_coef_bu for each node in each of the sliding windows on threshold 0.49 for all subjects
- clustering_coef_bu_4.9_1-rand1.mat: dynamic summary measure (e.g. variance) of clustering_coef_bu across windows for each node in the first random network on threshold 0.49 for all subjects
- clustering_coef_bu_4.9_1-rand_per_SW.mat: the clustering_coef_bu for each node in each random network in each of the sliding windows on threshold 0.49 for all subjects (i.e., cell comprised of: subjects x random networks x sliding windows)
6. Changed the normalization procedure for dynamic summary measures (this does not include "nodal flexibility/promiscuity":
- OLD normalization procedure: the dynamic summary measure of the orig. data was devided by the mean of the dynamic summary measure of the random data (there was a lot of information loss)
- NOW: first, per sliding window graph metrics are normalized as usual by division of the mean of the same graph metric derived in random networks in the same sliding window. Second, the dynamic summary measure is calculated across sliding windows of the beforehand normalized graph metrics.
Release info GraphVar_beta_v_06.12:
Again some bug fixes for "dynamic" calculations (THANKS to XIAOSONG HE for noticing these errors!)
- added the exception that for sliding windows also non-overlapping windows can be generated with gaps between windows
- fixed a bug that when generating sliding windows the last possible window was omitted from generating
- fixed a bug that the window size was erroneous window size+1
- fixed a bug that a cell2mat error occured for variance/standard deviation calculations with small-worldness (sliding windows)
Release info GraphVar_beta_v_06.11:
Mainly some small bug fixes that occured when using "static" matrices in "dynamic" GraphVar
- getMeanMatrix: corrected that plotting of MeanMatrix did not work when calculated without sliding windows (i.e., static matrix).
- Results: fixed a bug for plotting single subject matrices generated from time courses when no sliding windows were generated beforehand (i.e. static matrices).
- NetworkInspector: fixed a bug that "GetComponent" did not work when not generating random data but using parametric p-vals for initial link thresholds
- CalcVars: bugfix, that if individually generated "corr matrix" arrays were used (and not named "...Matrix") GraphVar stopped calculating when testing against random networks and using raw matrices.
Release info GraphVar_beta_v_06:
This Version offers some possibilities for Dynamic Functional Connectivity and Dynamic Graph Analyses -> DynamicGraphVar! Please read this for detailed info: DynamicGraphVar_Tutorial
Release info GraphVar_beta_v_05.1:
This release contains a bugfix that if numbers (e.g. 0 1) were used instead of strings (e.g. "male" "female") for defining groups (strings were suggested in the default variable sheet) group assignment mismatches could occure.
Release info GraphVar_beta_v_05.0:
- Create Connectivity Matrix:
- generate covariance matrices from input time series
- use SICE to produce binary graphs with a desired density from input time series
- features an additional method for producing random time series: randomizing the observed time series by taking its Fourier transform, scrambling its phase and then inverting the transform (Prichard, D., & Theiler, J. ;1994) - Network Construction:
- use SICE (sparse inverse covariance estimation) to estimate binary graphs across a desired density range
Release info GraphVar_beta_v_04.2:
- Statistical Analyses:
- included paired sample T-Test - e.g. for examining pre-post treatment effects (works for graph metrics, raw matrix, network based statistics)
Release info GraphVar_beta_v_04.0:
- Create Connectivity Matrix:
- Acceleration of connectivity matrix generation (achieved through vectorization) - Network Construction:
- Calculate and export graph topological measures now also without applying thresholds (i.e., on the fully connected matrix)
- Modify weights in the matrices by using “absolute weights” or “negative weights to zero” - Network Calculations
- GraphVar will warn you at the densities were negative weights will enter your calculations
- Inclusion of “Rich Club Coefficient” (please ignore the node labels in the export -> each column stands for level k) - Statistics
- Inclusion of non-parametric testing on the metric level for correlational analysis (i.e., testing against shuffled data) - Results Viewer
- plot single subject association matrices (e.g. for QC)
- plot mean connectivity matrices (i.e., connectivity across subjects) to determine the direction of your effects in more detail - Network Inspector
- open your identified graph component immediately in BrainNetViewer for 3D visualization (BrainNetViewer must be added to Matlab with subfolders)
Release info GraphVar_beta_v_03.2:
This release contains a bugfix (erroneous convertion of connection weights into connection-length weights) that impacted the calculation of the following WEIGHTED measures (binary was not affected): local char pathlength, global char pathlength, edge betweenness centrality, node betweenness centrality, small worldness
Release info GraphVar_beta_v_03.1:
This release offers more possibilities to generate connectivity matrices from time courses: besides pearson correlation and partial correlation, GraphVar now also enables creation of connectivity matrices based on percentage bend correlations, spearman correlation and mutual information - enjoy!
Release info GraphVar_beta_v_03:
Supports parallel computing! If you installed the MATLAB parallel computing toolbox, you can set the number of "Parallel Workers", GraphVar will distribute the subjects (generation of correlation matrices and random networks) into different CPU cores.
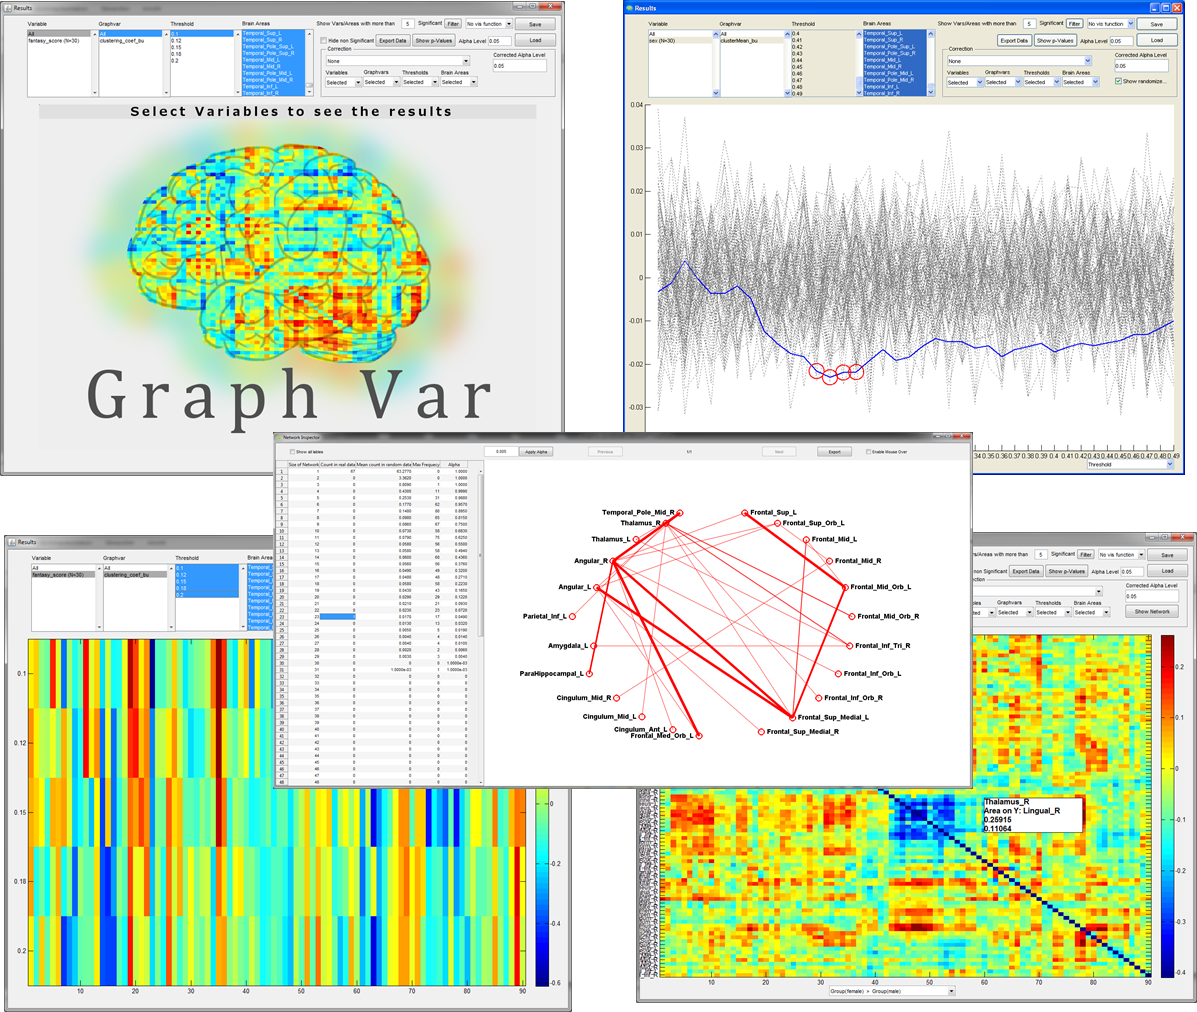
EXAMPLE OUTPUT of the Interactive RESULTS VIEWER:
Hi Johann,
Hi Johann,
Great work!
For partial correlation, how do you deal with the situation #nodes > #time points? The covariance matrix is not invertible then.
Have you ever considered using Graph Lasso as in Yan, C.G., Craddock, R.C., He, Y., Milham, M.P., 2013. Addressing head motion dependencies for small-world topologies in functional connectomics. Front Hum Neurosci 7, 910?
I shared my codes through http://rfmri.org/Scripts_YAN
Thanks,
Chao-Gan
Graphical Lasso
Hi Chao-Gan,
thanks again for the hint with the graphical lasso and for providing the script! I would really like to integrate this possibility as at the moment we do not have a possibility to deal with the case if #time points <= #ROIs.
However, until now I am relatively unfamiliar with graphical lasso but I have had a quick look at your script - it seems to me that the graphical lasso is somehow dependent on each sparsity threshold as you calculate delta sparsity from the estimated sparsity and subsequently compute the lasso-sparsity set...
GraphVar is written in a way that we have different modules which means that the generation of the conn matrix (or lasso matrix) is independent from the thresholding (density range), which the user has to select after the matrices were generated (i.e., we compute one correlation matrix, mutual information matrix etc. based on the single time courses for each subject - before the other procedures - as it is regularly done). You can see what our input/output is for generating the matrices (e.g. lines 47-53; 75-85; 139 in .../src/calc/GenerateFromTimecourses).
To deal with this problem and to provide a fast solution to the users (if I am somehow wrong with my assumption about the dependence of the sparsity range), it would be really awesome if you could help us by providing a script where the output is a single matrix for each subject that subsequently can be thresholded at the desired threshold ranges. Alternatively, I will think about how to rewrite the toolbox to compute these matrices based on the threshold selection.
Best,
Johann
Hi Johann,
Hi Johann,
When you look at http://d.rnet.co/Scripts_YAN/y_GLassoMatrix.m
The first part is getting the thresholded matrices. You can modify it into a single function.
parfor i=1:AutoDataProcessParameter.SubjectNum

        fprintf('Subject %s ',AutoDataProcessParameter.SubjectID{i});

        MAT = load ([FisherZDir,filesep,'ROISignals_ROITC',AutoDataProcessParameter.SubjectID{i},'.mat']);
        TC = MAT.ROISignals(:,493:608);
        TC = TC(:,1:NodeNumber);


        TC = (TC-repmat(mean(TC),size(TC,1),1))./repmat(std(TC),size(TC,1),1);


        [wList, thetaList, lambdaList, errors] = GraphicalLassoPath(TC,LassoLambdaTestSet);

        fprintf('Lasso OK.\n');

        Temp = thetaList<0; %Negative theta!!!
        %Temp = thetaList~=0; %Not Zero!!!
        EstimatedSparsity = squeeze((sum(sum(Temp,1),2)-NodeNumber)/NodeNumber/(NodeNumber-1));


        LassoLambdaSetTemp=zeros(1,length(SparsityRange));
        LassoSparsitySetTemp=zeros(1,length(SparsityRange));
        ThetaMatrixSetTemp=zeros(1,length(SparsityRange),NodeNumber,NodeNumber);

        for iSparsity=1:length(SparsityRange)


            DeltaSparsity = EstimatedSparsity - SparsityRange(iSparsity);
            [MinDelta,IndexSparsity] = min(abs(DeltaSparsity));

            LassoLambdaSetTemp(1,iSparsity) = LassoLambdaTestSet(IndexSparsity(1));
            LassoSparsitySetTemp(1,iSparsity) = EstimatedSparsity(IndexSparsity(1));


            Matrix = thetaList(:,:,IndexSparsity(1));

            ThetaMatrixSetTemp(1,iSparsity,:,:) = Matrix;


        end

        LassoLambdaSet(i,:) = LassoLambdaSetTemp;
        LassoSparsitySet(i,:) = LassoSparsitySetTemp;
        ThetaMatrixSet(i,:,:,:) = ThetaMatrixSetTemp;

    end

    save([OutputDir,filesep,'GTA_BinarizedUndirected_LassoLambdaSet.mat'],'LassoLambdaSet','LassoSparsitySet','ThetaMatrixSet');
It's very easy to modify this function into your GraphVar, but I currently don't have time. Please keep in mind, all the codes written by me are under GNU GPL license. Thus, you can use them freely as long as you comply to GNU GPL.
Thanks,
Chao-Gan
Error in GraphVar
Hi,
I'm trying to use GraphVar, but am coming up with an error. I am using Matlab 2012b for 64-bit Linux. I created connectivity matrices from data generated in dpabi, but when I try to run "Calculate and Statistics", I get the following message. Any help would be appreciated:
Thanks,
Matt
Error using cell/ismember>cellismemberlegacy (line 131)
Input A of class char and input B of class cell must be cell arrays of strings,
unless one is a string.
Error in cell/ismember (line 76)
[varargout{1:nlhs}] = cellismemberlegacy(varargin{:});
Error in GraphVar_getDialogData>check_StructureName (line 305)
if(sum(~ismember(name,handles.vpNamesNeo)) && isFirst)
Error in GraphVar_getDialogData (line 35)
if(~check_StructureName(handles,forCalcFunc))
Error in GraphVar_calc (line 29)
[returnVal,dialogData] = GraphVar_getDialogData(handles,1,noCorr);
Error in GraphVar>Btn_calcCorr_Callback (line 71)
[res allTask] = GraphVar_calc(handles);
Error in gui_mainfcn (line 96)
feval(varargin{:});
Error in GraphVar (line 40)
gui_mainfcn(gui_State, varargin{:});
Error in
@(hObject,eventdata)GraphVar('Btn_calcCorr_Callback',hObject,eventdata,guidata(hObject))
Error while evaluating uicontrol Callback
Help for error in GraphVar
Hi Matt,
it seems like your subject ID´s are encoded by GraphVar as numeric values and not as a string (we are really sorry, that might be a bug in our software). You can check this, if you reload your variable sheet (with the subjects demographic data) and the checkbox in the second column next to your subject IDs is checked automatically. The radio button (first column) has to indicate your subject ID and there should not be any check in the second column. If you load the variable sheet from the sample workspace you can see how the setup should look like.
This bug seems to occur when using .csv and numerical subject identifiers. We develop mainly on Windows with Excel spreadsheets where this bug did not occur so far (so we did not notice until your question). Thanks for your question; we will fix that as soon as possible!
The best solution at the moment would be to rename your subject IDs with not only numbers to circumvent this problem (i.e., to use subject identifiers that not only contain numbers as "subject1" or "s1"... etc.)
Again, we are sorry for this inconvenience!
Thanks!
Hi Johann,
Thanks, that worked!
Best,
Matt
Similar Problem
Hi,
I seem to be having a similar problem with my Matlab (R2013a) producing the following error:
Error using cell/ismember>cellismemberR2012a (line 199)
);
StructureName (line 361)vpNamesNeo)) && isFirst) && handles.FragCheck ~= 1
handles,forCalcFunc))
handles,1,noCorr);
Btn_calcCorr_Callback',hObject,eventdata,guidata(hObject))
Input A of class char and input B of class cell must be cell arrays of strings, unless one is a string.
Error in cell/ismember (line 71)
[varargout{1:nlhs}] = cellismemberR2012a(varargin{:}
Error in GraphVar_getDialogData>check_
if(sum(~ismember(name,handles.
Error in GraphVar_getDialogData (line 54)
if(~check_StructureName(
Error in GraphVar_calc (line 29)
[returnVal,dialogData] = GraphVar_getDialogData(
Error in GraphVar>Btn_calcCorr_Callback (line 73)
[res allTask] = GraphVar_calc(handles);
Error in gui_mainfcn (line 96)
feval(varargin{:});
Error in GraphVar (line 40)
gui_mainfcn(gui_State, varargin{:});
Error in @(hObject,eventdata)GraphVar('
Error while evaluating uicontrol Callback
I have checked my variables sheet and my subject IDs are coded as not-only numbers as you suggested (I have subject001-subject052) however when the dialog box to choose the variables opens the radial button is automatically selected for the subject ID but the checkbox is not automatically chosen for my other variable of interest. This is a list of numbers between 0 and 1 with 4 decimal places. Is this variable my issue?
Cheers
Dan
Important bug fix in GraphVar_beta_0.32
Generate randomized subject data erroer
I am trying to analyze some data using GraphVar but when I choose to "generate randomized subject data" in my analysis io get the following error:
Error using randomizer_bin_und (line 31)
Help on randomization
Re: Help on randomization
Johann,
Thank you fo your quick reply. I've taken the snippet of code from the randomizer_bin_und function that checks for directedness and run it against all of my matricies and they do pass those tests. I know my matricies are undirected (they are taken directly from DPARSFA) and the error happens very quickly after the calculation begins regardless of which of my datasets I use. Any other ideas on what could be causing this?
Bryson
Again: Help on randomization
Hi Bryson,
this seems really odd. GraphVar works like this: it will take your subject´s matrix and perform the thresholding (if you do proportional thresholding, the first check for symmetry is already done in BCT´s “threshold_proportional”). Depending on your graph metric choice (this should be a binary function/metric if you want to use the “randomizer_bin_und”) , GraphVar will set the network to binary/(weighted). Subsequently, the thresholded binarized matrix is handed over to the “randomizer_bin_und” function and the random network is generated. So if there is an error that explicitly says (as you posted) “Matrix should be undirected” resulting the “randomizer_bin_und” function, the thresholding function already appears to detect the matrix as directed.
Here is what I would do/suggest to test your matrices:
With DPARSFA I have had the experience that sometimes there are for some reasons rounding problems during generation of the correlation matrix which are not visually detectable (problem wrt symmetry: DPARSFA calculates each single cell in the matrix and not simply mirrors the upper half - I think). To make it work I would suggest to use DPARSFA to extract the time courses (ROI Signals) of your nodes and subsequently generate the connectivity matrix with GraphVar (here we mirror the values). Let me know if this works.
Best, Johann
No data to do statistics with
Johann,
So I'm in the process of fixing my data to work with GraphVar (they're difference matricies, so they need to be adjusted) and your suggestions have really helped. But, now I'm using conn matrices that were created in graphvar from DPARSF ROIsignals files. I'm using those calculated correlation matrices to correlate with other measures, but when I run the analyses it end with an error that says something to the effect of, "There's no valid data to do statistics with." Any suggestions for this problem?
Thanks in Advance, Bryson
AW: [RFMRI] GraphVar - a user
Variable as a string
Johann,
My variables are a continuous integers (for example age or test score). I am running GraphVar on a mac and am therefore using semicolon separated csv files instead of xls. Could this be the cause of my issue? How can I fix it?
Thanks in Advance, Bryson
string as variable
Vaiables in a .csv format
Johann,
Modifying my variable sheet seems tro have fixed it. For anyone else, in a csv file if you have a semicolon after the entry, then it will be considered a string, but if you have a comma after it it will be considered a number. At least this seems to work for me as a general rule.
Bryson
Question about the show network in results panel
Excuse me. I'm learning how to use this software in matlab. But there got one question when I tried to click 'show Network' in the results panel.
It shows that it can not get in one iterator which caused the error for not got the isGroup variable .(Error in Results_btn_network_Callback>loadAndProcessData (line 364)).
Wait for your assistance. Thanks.
show network
Dear Johann,
Dear Johann,
First of all, thank you for creating this useful tool! It seems to be valuable for both scripting-experienced and non-experienced users, as it gives a broad view possible analyses to be made.
I am using Matlab R2013a on Windows 8, 64bit, with Microsoft Excel installed, and have encountered some problems I was hoping you could help me solve.
1) The first is that after creating a new workspace, whenever I try going back to the SampleWorkspace one, I get an error. I copied it at the end of this post, under “Error Reloading SampleWorkspace Error”. I am not sure why the variableSheet is undefined. I have both csv and xlsx files, and I haven’t changed them.
2) In my own workspace, I have tried computing the “Weighted: Community structure Newman – affiliation”. Upon pressing the “Calculate variables and export”, I get an error. I copied it at the end of this post, under “Error Computing Community Structure”.
3) I am not sure if this is a bug or not, but it seems that if I try creating a workspace with only one subject, it is not possible to use the “Select Subjects (Conn Matrix)” button. Trying to use it, no subjects appear in the Subjects window.
Any help would be greatly appreciated!
Thank you,
Roey
Error Reloading SampleWorkspace
============================
Undefined function or variable "variableSheet".
Error in GraphVar_OpeningFcn (line 68)
set(handles.edit_varxls,'String',variableSheet,'Value',1);
Error in gui_mainfcn (line 221)
feval(gui_State.gui_OpeningFcn, gui_hFigure, [], guidata(gui_hFigure), varargin{:});
Error in GraphVar (line 40)
gui_mainfcn(gui_State, varargin{:});
Error in Welcome>LoadWorkspace_Callback (line 194)
GraphVar('Workspace',fullfile(workspace_path,workspace));
Error in gui_mainfcn (line 96)
feval(varargin{:});
Error in Welcome (line 42)
gui_mainfcn(gui_State, varargin{:});
Error in @(hObject,eventdata)Welcome('LoadWorkspace_Callback',hObject,eventdata,guidata(hObject))
Error while evaluating uicontrol Callback
Error Computing Community Structure
================================
Error using cell/ismember>cellismemberR2012a (line 199)
Input A of class char and input B of class cell must be cell arrays of strings, unless one is a
string.
Error in cell/ismember (line 71)
[varargout{1:nlhs}] = cellismemberR2012a(varargin{:});
Error in GraphVar_getDialogData>check_StructureName (line 359)
if(sum(~ismember(name,handles.vpNamesNeo)) && isFirst)
Error in GraphVar_getDialogData (line 53)
if(~check_StructureName(handles,forCalcFunc))
Error in GraphVar_calc (line 29)
[returnVal,dialogData] = GraphVar_getDialogData(handles,1,noCorr);
Error in GraphVar_CalcExport_Callback (line 42)
[res allTasks] = GraphVar_calc(handles,1);
Error in gui_mainfcn (line 96)
feval(varargin{:});
Error in GraphVar (line 40)
gui_mainfcn(gui_State, varargin{:});
Error in
@(hObject,eventdata)GraphVar('GraphVar_CalcExport_Callback',hObject,eventdata,guidata(hObject))
Error while evaluating uicontrol Callback
Has anyone encountered these errors before?
If anyone had encountered these errors before and has found a solution I would be grateful.
Thank you,
Best,
Roey
3 errors reply
Hi Roey,
sorry for the late reply ... must have overseen these comments:
1. I tried to replicate this problem on some computers and strangely could only replicate it on one. Attached you find a script that should fix the error. Put it in scr.gui.GrapVar: DOWNLOAD HERE
2. I could not replicate this error... on all computers the weighted version of the affiliation vector could be calculated and exported - However, I do not have a MATLAB 2013 version to test (I have 2011 2014)
3. yes - you will always have to select two subjects
Best,
Johann
Errors persist
Dear Johann,
Thank you for your help!
I'm afraid the errors still persist:
1. Switching between workspaces still gives this odd error, even after replacing the GraphVar_OpeningFcn.m file. I could replicate this error both on my PC and on another one, with Windows 7, Matlab 2011b.
2. I could calculate the community structure on the template workspace, but now got an error on my own workspace (see attached). I intently used 90 AAL ROIs in my own data to make use of the same Excel sheet for the BrainRegions.xlsx file, but that did not solve the problem.
3. Thank for clarifying this!
Best,
Roey
==================
error again
Hi,
1. For me everything works somehow - for being able to replicate what you experience you would have to send me the exact steps (I did: 1: start_GraphVar; open sample workspace; swith workspace (gui button); create new workspace; open new workspace; switch workspace back to sample workspace. 2: start_GraphVar; create new workspace; open new workspace; switch workspace back to sample workspace) ... This works fine for me. What do you do? Can you please try adding GraphVar completely new to your path (i.e., installing the default verison) and see if this still occurs?
2. The error you posted is not related to the BrainRegionsFile but to the variables sheet and tells you (if I am not mistaken as I don´t know your settings) that your variables sheet does not contain a string column header (as "gender", "research_site").
Best would be you simply send me your workspace (with all modifications) and I can try running it on my computer to see what´s the problem.
Best,
Johann
I have encountered the same problem
Dear Johann,
I got the same problem. Even if I deleted my own workspace, removed GraphVar from Matlab path, exited Matlab, reopened Matlab, added eGraphVar into the path. Then I started with 'start_GraphVar', click on sampleworkspace, it crushed again and give the same error.
When I check the 'GraphVar_OpeningFcn.m', there was a warning with the "variableSheet", it said, the variable may be used before it is defined.
I don't know how to fix that. Can you help me? Thank you very much!
Sincerely,
Phil
Effective connectivity
Hi Johann,
I really enjoy GraphVar. Can I use it to analyze effective connectivity?
effective connectivity
Matlab pool error
Hi Johann,
I am getting the follow error when running GraphVar on Matlab 2015a. This only happens when 'generate random network' is selected, and the process always stops at step 29 and produces an error.
Error using matlabpool (line 27)
matlabpool has been removed.
To query the size of an already started parallel pool, query the 'NumWorkers' property of the pool.
To check if a pool is already started use 'isempty(gcp('nocreate'))'.

Error in CalcVars (line 376)
            if (exist('matlabpool'))&& matlabpool('size') ~= 0;

Error in GraphVar_calc (line 85)
[res,shuffelFiles] =
CalcVars(dialogData.
'DoRandom',get(handles.
,randomNetwork_func , 'RandomIterations' , dialogData.randomIter, 'Smallworldness',
get(handles.RandomNetwork_
[get(handles.binary_check,'
dialogData.DynamicGraphVar,'n_
Error in GraphVar>Btn_calcCorr_Callback (line 73)
[res allTask] = GraphVar_calc(handles);
Error in gui_mainfcn (line 95)
feval(varargin{:});
Error in GraphVar (line 40)
gui_mainfcn(gui_State, varargin{:});
Error in @(hObject,eventdata)GraphVar('
Error while evaluating UIControl Callback
I was wondering if you had any advice?
Many thanks,
Charles
Parallel Computing in MATLAB 2015
Hi,
please substitute this script (DOWNLOAD and unzip) in src/gui/GraphVar
The error you got was because in Matlab 2015 "matlabpool" has been removed. The new script additionally uses "gcp" to initiate the parallel workers (which can be used for creation of random networks).
Hope this helps,
Johann
Parallel Computing in MATLAB 2015
Hi Johann,
Thank you so much for your help. Unforunately the problem persists with the following message:
Error using matlabpool (line 27)
matlabpool has been removed.
To query the size of an already started parallel pool, query the 'NumWorkers' property of the pool.
To check if a pool is already started use 'isempty(gcp('nocreate'))'.

Error in CalcVars (line 376)
            if (exist('matlabpool'))&& matlabpool('size') ~= 0;

Error in GraphVar_calc (line 85)
[res,shuffelFiles] =
CalcVars(dialogData.thresholds,dialogData.thresholdType,dialogData.brainD,dialogData.functionList,handles.vpFiles,'TaskPlaner',allTasks,'MatrixName',dialogData.MatrixName,'FilePos',dialogData.subjectNamePos,
'DoRandom',get(handles.RandomNetwork_check,'Value'), 'nRandom', dialogData.nRandom, 'RandomFunction'
,randomNetwork_func ,  'RandomIterations' , dialogData.randomIter, 'Smallworldness',
get(handles.RandomNetwork_smallWorld,'Value'), 'randomForType',
[get(handles.binary_check,'Value'),get(handles.weighted_check,'Value')],'pValueField',handles.sigField,'TestAgainstRandom',get(handles.TestAgainstRandom,'Value'),'DoShuffelRandom',get(handles.shuffel_check,'Value'),'NShuffelRandom',dialogData.nShuffel,'Normalize',dialogData.normalize,'RandomRaw',dialogData.shuffleRandom,'RandomRawIter',dialogData.RandomRawIter,'NoCorr',noCorr,'InterimResult',InterimResultsID,'weightAdjust_Thr',dialogData.weightAdjust_Thr,'DynamicGraphVar',
dialogData.DynamicGraphVar,'n_multislice', dialogData.n_multislice);

Error in GraphVar>Btn_calcCorr_Callback (line 73)
[res allTask] = GraphVar_calc(handles);

Error in gui_mainfcn (line 95)
        feval(varargin{:});

Error in GraphVar (line 40)
    gui_mainfcn(gui_State, varargin{:});

Error in @(hObject,eventdata)GraphVar('Btn_calcCorr_Callback',hObject,eventdata,guidata(hObject))


Error while evaluating UIControl Callback
Problem with Mac Os Sierra running Matlab 2017a
Hello Johann! Thank you for the great software.
I uptaded my Mac to Sierra and Matlab 2017a and it seems that Graphvar stopped running. The whole software won't let me run any functions now. I tried to substitue the above script in src/gui/GraphVar without any help. What would you suggest me to do? Thank you in advance.
When I start the software I get the following report:
Issues running a project
Thank you for this pretty cool toolbox, it will save me tons of time. I am encountering issues analyzing my data. My data consists of functional connectivity matrices each in a *.mat file. I am able to load the data on GraphVar, but once I click on "Calculate & Statistics" I obtained the following:
Reference to non-existent field 'FragCheck'.
Error in GraphVar_getDialogData>check_StructureName (line 361)
if(sum(~ismember(name,handles.vpNamesNeo)) && isFirst) && handles.FragCheck ~=
1
Error in GraphVar_getDialogData (line 54)
if(~check_StructureName(handles,forCalcFunc))
Error in GraphVar_calc (line 29)
[returnVal,dialogData] = GraphVar_getDialogData(handles,1,noCorr);
Error in GraphVar>Btn_calcCorr_Callback (line 73)
[res allTask] = GraphVar_calc(handles);
Error in gui_mainfcn (line 96)
feval(varargin{:});
Error in GraphVar (line 40)
gui_mainfcn(gui_State, varargin{:});
Error in
@(hObject,eventdata)GraphVar('Btn_calcCorr_Callback',hObject,eventdata,guidata(hObject))
Error while evaluating uicontrol Callback
I don't obtain such message when I run the example project. I use Matlab 2011b. Thanks!
Non-existent field 'FragCheck'
I am getting the exact same error when I try to compute any of the graph metrics. Help would be greatly appreciated. Thanks.
help on 'FragCheck'
Hi,
is it possible that you have any old copy of GraphVar in your Matlab path? This could cause the problem...
Alternatively it would be good to know which operating system you use - sometimes variables get picked up differently from the GUI in Windows versus Linux (the new CheckFrag function is the problem).
For a really quick help (that should solve this problem): open the script in GraphVar_beta_v_06.2/src/gui/GraphVar/GraphVar_get_DialogData.m and delete the "&& handles.FragCheck ~= 1" in line 361.
Let me know if it works,
Johann
Thanks
Thank you, Johann. I have tried commenting out that entire IF - ELSE loop (I will next do as you recommend and only delete the second part of the statement), and the code seems to run then, but the progress bar is definitely malfunctioning (for example, the very top bar can be at 4036 of 672 operations).
The CheckFrag issue has been happening on both Mac (OS X 10.11.1) and on Windows.
Unrelated question: When selecting random time series to be generated (100) along with sliding window correlations to be computed (84 windows total for each of 24 subjects in my case, 82 regions of interest), Step 2: Correlating Vars pops up, but there is absolutely no progress happening - is this step supposed to be computationally very intensive? (I am using a computer with 32 GB of RAM and a 4.0 GhZ Intel Core i7 processor) and Every time I've tried running this, I've just ended up force quitting Matlab :(
Thanks.
Best,
Sanja
... random time series
Hi Sanja,
I will try to figure out why this CheckFrag problem happens ... until now I could not replicate the error - sorry.
Yes - the statusbar is incorrect if you operate with sliding windows (we have added this feature after the status bar was programmed - we will update this issue asap).
The operation you want to do is pretty computationally intensive - you see this if you look at your CPU workload. You could speed this up by using multiple CPU´s (number of workers). It will be considerably faster if no random time series are generated (however, you may need to do this if you wish to use these non-parametric p-values for thresholding of the network - i.e., significance based thresholding). If you decide to skip this feature you could still use relative or absolute thresholding.
Best,
Johann
Hi,
Hi,
is it possible that you have any old copy of GraphVar in your Matlab path? This could cause the problem...
Alternatively it would be good to know which operating system you use - sometimes variables get picked up differently from the GUI in Windows versus Linux (the new CheckFrag function is the problem).
For a really quick help (that should solve this problem): open the script in GraphVar_beta_v_06.2/src/gui/GraphVar/GraphVar_get_DialogData.m and delete the "&& handles.FragCheck ~= 1" in line 361.
Let me know if it works,
Johann
Re: [RFMRI] GraphVar - a user
Re: [RFMRI] GraphVar - a user
"The first subject name could not be found in the excel sheet do you want to continue?" even as File with Variables is empty. In case I click "yes" I obtain error messages.
Variable Sheet
Hi,
Yes - I am aware of this issue and will change this asap. For now please organize yourself a "fake" variable sheet with the subjects names in the ID column and highlight the subject name accordingly in GraphVar... this will work (keep to the format of the sample variable sheet).
Originally, the requirement of a variable sheet and highlight of the subject name was thought as a precaution to not mixup subject data. Sorry about that!
Best,
Johann
Variable Sheet
Hi Johann,
Has the issue been fixed since? I have version 0.62. Even as I placed "fake" variable sheet unfortunately I haven't been succesful at obtaining graph metrics using GraphVar. Thanks!
Hi,
SICE
Q: Is the SICE target density in Generate Conn Matrix the same meaning as SICE threshold in Network Construction panel?
A: No. SICE (also referred to as graphical lasso) in Generate Conn Matrix can be used to create conn matrices with a predefined density (i.e., you will get a set of matrices with a specific network threshold obtained by sparse inverse covariance estimation). This procedure will use the time series data. In the Nework construction panel SICE is an alternative option to relative thresholding. Here covariance matrices are required as input. These can be created from the time series using the Generate Conn Matrix function.
Q: Is it appropriate to calculate graph metrics with SICE or Covariance data?
A: This is basically an alternative way of constructing networks based on partial correlations which should be used if there are more nodes (ROIs) in the network as compared to time points of your data. Please have a look in the GraphVar article for a detailed description. Yes - it is appropriate to calculate graph metrics with SICE.
Q:Is it possible to do group comparison as Shuai Huang did in his article?
A: GraphVar offers parametric and non-parametric group comparisons. These are done after the graph metrics are obtained from e.g. the networks thresholded with the SICE option.
SICE question
Hi, Kruschwitz
Thanks for your clarifing about SICE options. I've tried to calculate graph metrics with covairance matrix using multiple SICE threshold, but there is always an error in randomizer_bin_und indicating that "Matrix should be undirected". The design page was attached.
Would you please give me any hint about this?
Thanks
Hua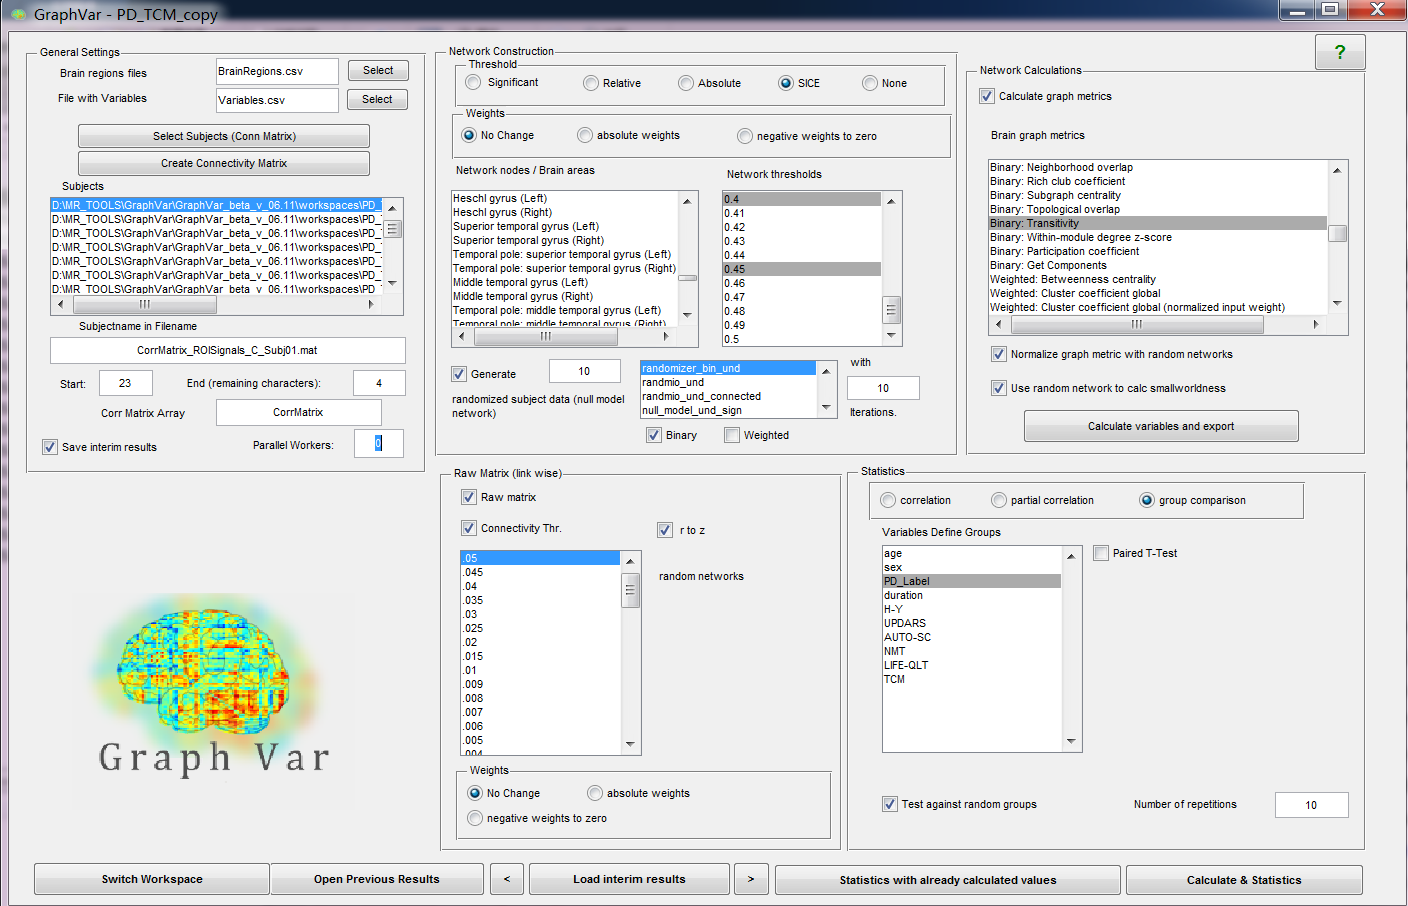
SICE undirected
Dear Hua,
the SICE function uses an approximate algorithm to calculate the inverse of the covariance matrix. We were unaware that this could lead to asymmetric matrices. Any asymmetry of the SICE should be below the 10e-4 tolerance of the estimation. We believe that in your case, the 10e-4 were just enough to affect the thresholding, i.e. to switch a zero to a one or vice versa. We have fixed the SICEDense.m function so that this error should not occur again (now we mirror the upper diagonal).
DOWNLOAD THE NEW SICE HERE.
Best!
Error in File CalcVars.m
Hi all,
I got this error while doing the Chilli_Contest tutor with GraphVar 6.2 on Matlab 2010a:
Hello,
Hello,i am new to graphvar and i do this settings,the dimentions of my data are 230*1568
when i am running this window occers and running still as it at 2 of 45100,there is no continue in operations.
when i see i command window there is no error.
please i want your advances.
Thanks.
Error in Graph Var
I am currently trying to use graph-Var on my matrices obtained fromn EEG Connectivity analyses and get an error measure while using the statistics GUI:
----------
Error using cell/ismember (line 27)
Input must be cell arrays of strings.
Error in GraphVar_getDialogData>check_StructureName (line 361)
if(sum(~ismember(name,handles.vpNamesNeo)) && isFirst) && handles.FragCheck ~= 1
Error in GraphVar_getDialogData (line 54)
if(~check_StructureName(handles,forCalcFunc))
Error in GraphVar_calc (line 29)
[returnVal,dialogData] = GraphVar_getDialogData(handles,1,noCorr);
Error in GraphVar>Btn_calcCorr_Callback (line 73)
[res allTask] = GraphVar_calc(handles);
Error in gui_mainfcn (line 96)
feval(varargin{:});
Error in GraphVar (line 40)
gui_mainfcn(gui_State, varargin{:});
Error in @(hObject,eventdata)GraphVar('Btn_calcCorr_Callback',hObject,eventdata,guidata(hObject))
Error while evaluating uicontrol Callback
--------
I have already tried to rename the Subjects-ID in the Variables-sheet and the .mat files..Nothing has worked until now.
Additionally I had problems with a few network parmeters:
1) Clustering coefficient:
Error using ./
Matrix dimensions must agree.
Error in clustering_coef_wu (line 21)
C=cyc3./(K.*(K-1)); %clustering coefficient
Error in clusterMean_wu (line 2)
D = mean(clustering_coef_wu(W));
Error in CalcVars (line 606)
ResultRandVar{i_extSub,r_idx,i_dyn} = eval([functionList{i_func}
'(ResultRand{i_extSub,r_idx,i_dyn})']);
Error in GraphVar_calc (line 85)
[res,shuffelFiles] =
CalcVars(dialogData.thresholds,dialogData.thresholdType,dialogData.brainD,dialogData.functionList,handles.vpFiles,'TaskPlaner',allTasks,'MatrixName',dialogData.MatrixName,'FilePo
Error in GraphVar_CalcExport_Callback (line 42)
[res allTasks] = GraphVar_calc(handles,1);
Error in gui_mainfcn (line 96)
feval(varargin{:});
Error in GraphVar (line 40)
gui_mainfcn(gui_State, varargin{:});
Error in @(hObject,eventdata)GraphVar('GraphVar_CalcExport_Callback',hObject,eventdata,guidata(hObject))
2) Small-World-Propensity:
Error while evaluating uicontrol Callback
Output argument "SWP" (and maybe others) not assigned during call to "G:\Masterarbeit
Daten\GraphVar\GraphVar_beta_v_06.2\src\ext\Network Community Toolbox\small_world_propensity.m>small_world_propensity".
Error in CalcVars (line 606)
ResultRandVar{i_extSub,r_idx,i_dyn} = eval([functionList{i_func}
'(ResultRand{i_extSub,r_idx,i_dyn})']);
Error in GraphVar_calc (line 85)
[res,shuffelFiles] =
CalcVars(dialogData.thresholds,dialogData.thresholdType,dialogData.brainD,dialogData.functionList,handles.vpFiles,'TaskPlaner',allTasks,'MatrixName',dialogData.MatrixName,'FilePo
Error in GraphVar_CalcExport_Callback (line 42)
[res allTasks] = GraphVar_calc(handles,1);
Error in gui_mainfcn (line 96)
feval(varargin{:});
Error in GraphVar (line 40)
gui_mainfcn(gui_State, varargin{:});
Error in @(hObject,eventdata)GraphVar('GraphVar_CalcExport_Callback',hObject,eventdata,guidata(hObject))
Error while evaluating uicontrol Callback
3)
Subscripted assignment dimension mismatch.
Error in GraphVar_CalcExport_Callback (line 108)
globalOut(:,globalC) = [tmpFunctionList{i_func} ; rot90(Result,3)];
Error in gui_mainfcn (line 96)
feval(varargin{:});
Error in GraphVar (line 40)
gui_mainfcn(gui_State, varargin{:});
Error in @(hObject,eventdata)GraphVar('GraphVar_CalcExport_Callback',hObject,eventdata,guidata(hObject))
Do you have any ideas how to fix those problems? We would be very pleased!
Thanks a lot in advance!
Graph Var don't work
Thank you for useful GraphVar, it is very useful for calculating graph metrics. But i met some question, it stop working when it finished 47%. there no any error. i try to exit it and open it again and again. the results are same. i don't know what's wrong with it .Can you help me?
Please Update your GraphVar version
Hi,
I noticed from the screenshot that you are using an old GraphVar version. Please update to the recent version and try if the error still occurs.
Best,
Johann