ROI wise comparison text files

Submitted by shuvro on
Forums
 Hello, 
I'm trying to run functional connectivity using ROI wise comparison between regions.  After detrending, filtering, choosing ROIs, inputting covariables and performing the functional connectivity, the program gave me the expected text files. Does the ROI_FCMap_  file represent the time course before or after the covariable have been regressed out? If it is before the covariables have been accounted for, is there a way to acquire the time course after the covariables have been regressed out?

Thanks for your help in this matter

Detrending error in LINUX system

Submitted by dargonchow on
Forums

Dear REST experts

Recently , we moved our analysis platform from windows to 64 bits centos 5.3 system with Matlab R2009a

All the resting fmri data were processed by using DPARSF_V1.0_Beta_090701

when enter into the stage of remove linear trend  , we meet the following error

could someone can help us to slove the problem ?

===========================================================================================
Removing the linear trend:

Stat maps

Submitted by alex on
Forums
 Hi all,
This may seem like a basic question, but I just wanted to check whether entering the single-subject FC or zFCmaps produced by REST  into a one-sample t-test in spm is an appropriate way to generate a group-averaged stat map.
Thanks,
Alex 

Data Processing Assistant for Resting-State fMRI (DPARSF) V1.0

Submitted by YAN Chao-Gan on
Predefined Types
Taxonomy upgrade extras

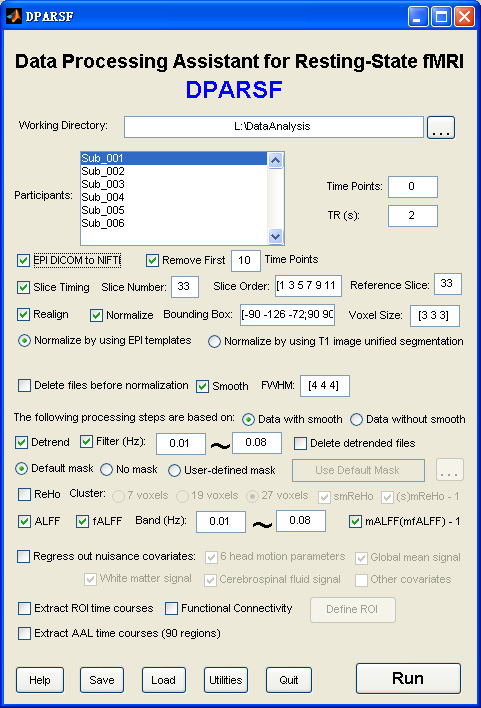
Data Processing Assistant for Resting-State fMRI (DPARSF) is a convenient plug-in software based on SPM and REST. You just need to arrange your DICOM files, and click a few buttons to set parameters, DPARSF will then give all the preprocessed (slice timing, realign, nomalize, smooth) data, FC, ReHo, ALFF and fALFF results. DPARSF can also create a report for excluding subjects with excessive head motion and generate a set of pictures for easily checking the effect of normalization. You can use DPARSF to extract AAL or ROI time courses (or extract Gray Matter Volume of AAL regions, command line only) efficiently if you want to perform small-world analysis. This software is very easy to use, just click on buttons if you are not sure what it means, popup tips would tell you what you need to do. You also can download a MULTIMEDIA COURSE to know more about how to use this software. Add DPARSF's directory to MATLAB's path and enter "DPARSF" in the command window of MATLAB to enjoy it.

The latest release is DPARSF_V1.0_100510


DOWNLOAD 

Multimedia Course: Data Processing of Resting-State fMRI

New features of DPARSF_V1.0_100510:
1. Added a right-click menu to delete all the participants' ID.
2. Fixed a bug in converting DICOM files to NIfTI in Windows 7, thanks to Prof. Chris Rorden's new dcm2nii.
3. Now will detect if co* T1 image (T1 image which is reoriented to the nearest orthogonal direction to 'canonical space' and removed excess air surrounding the individual as well as parts of the neck below the cerebellum) exists before normalization by using T1 image unified segmentation. T1 image without 'co' is also allowed in the analysis now.

New features of DPARSF_V1.0_100420:
1. After extracting ROI time courses, not just functional connectivity will be calculated, but also transform the r values to z values by Fisher's z transformation.
2. Fixed a bug in generating pictures for checking normalization when the bounding box is not [-90 -126 -72;90 90 108].

ROI definition

Submitted by alex on
Forums
 Hi,
I am trying to run a correlation for a group of subjects at once. I have the timecourses for my seed ROI in text files. It seems however, that the option for defining voxelwise ROIs using text files only allows one file to be loaded at a time. Is it possible to load multiple text files, corresponding to the seed timecourses for each subject?
Thanks for your help,
Alex

Anticorrelations

Submitted by alex on
Forums
 Hi again,
I am interested in using REST to examine anticorrelations. I just wanted to check the following:
1 - If I include a global signal timeseries as a covariable, then the analysis will produce maps showing voxels significantly correlated with the seed timecourse after controlling for global signal fluctuations. That is, it is essentially like performing a global signal regression. Is this correct?
2 - Anticorrelations will be revealed by negative values in the resulting connectivity and z-maps. Is this correct?

thanks for your help,

Pleae resmaple your mask or ROI definition file first!

Submitted by YAN Chao-Gan on
Forums
Hi, Cleofé Peña Gómez!
     1. You need to resample your mask or ROI file to the dimension of your functional images.
          There were three ways: (1) use SONG Xiao-Wei's program, from http://restfmri.net/forum/node/78                              
                                                 (2) use my program, from http://restfmri.net/forum/node/81   (the third one)
                                                 (3) use SPM5:
                                                                       a. Click "Coregister"
                                                                       b. Click "New "Coreg: Reslice""
                                                                       c. "Image Defining Space": choose one of your functional image. e.g. your normalized functional image or image after Detrend and Filter.
                                                                       d. "Images to Reslice": choose the mask file or ROI definition file. e.g. BrainMask_05_61x73x61.img
                                                                       e. "Reslice Options" -> "Interpolation": choose "Nearest neighbour"
                                                                       f. Just click "Run". Then you will get the resmapled mask or ROI file with a surfix of "r".