Hello,
I am trying to conduct a paired samples t-test, looking at differences in graph metrics pre and post an intervention. However, I am having some difficulty setting up this analysis in GraphVar.
I followed the within design I tutorial, however that is looking at change in a graph metric i.e. efficiency in T1 and T2 between sex. However, I am only interested in changes in graph metrics between T1 (pre) and T2 (post).
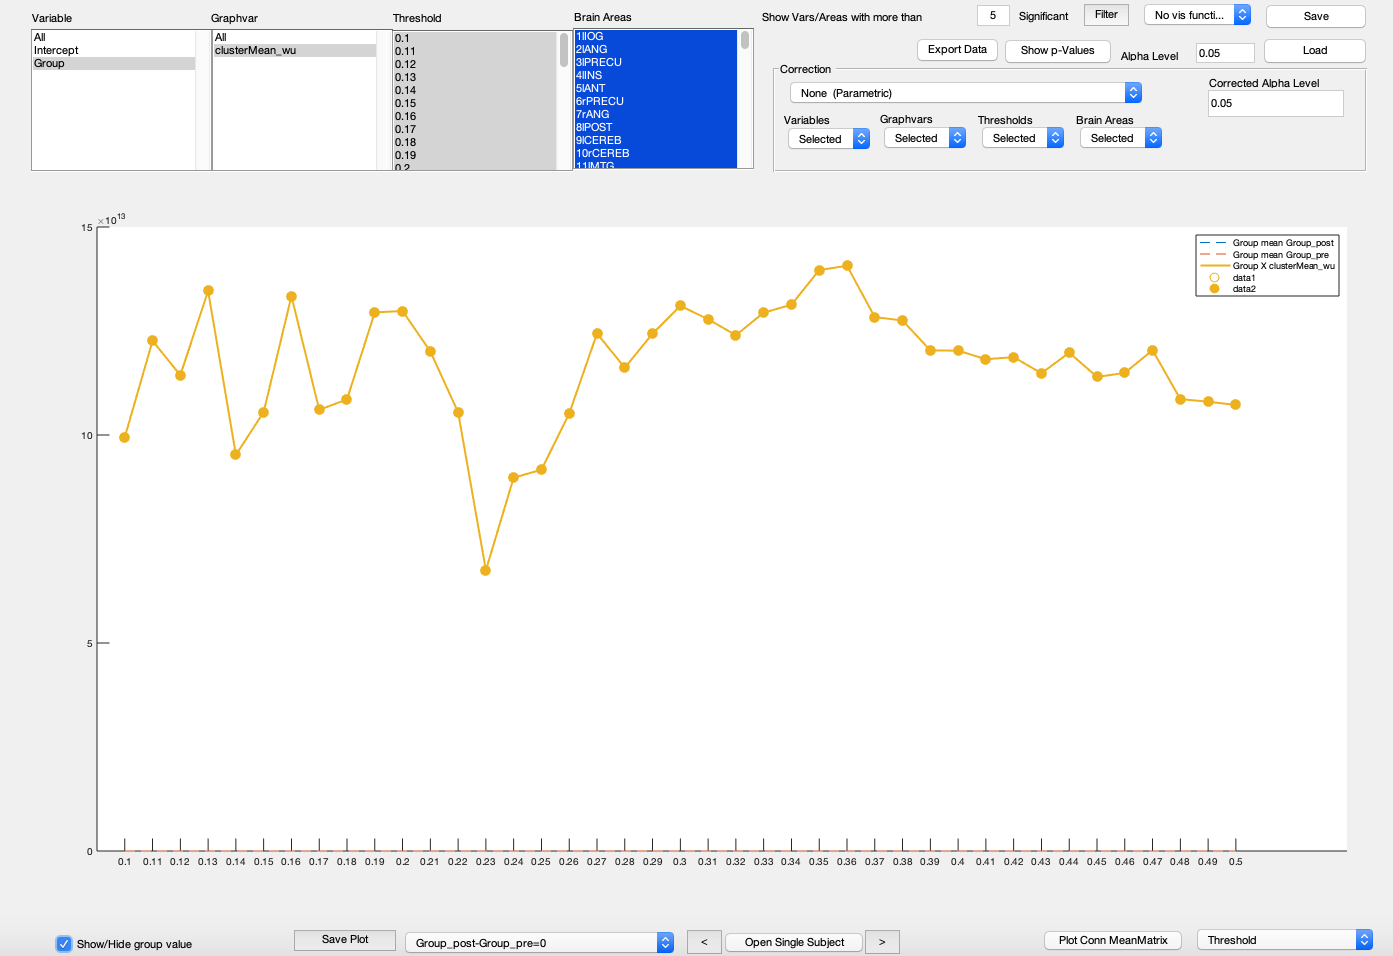
I have attached my variable sheet to show what I have currently been doing. For the GLM, I selected group (pre and post) as the between factor and subj_ID as the Within ID. However, the results I get do not look right (see attached Results). The yellow line with filled in circles is telling me that the t-test is significant. However, the two lines representing pre and post values are superimposed on each other and at zero.
How would I set up my variable sheet as well as the GLM to run a paired samples t-test?
Thank you in advance.
| Attachment | Size |
|---|---|
| Variables.xlsx | 9.03 KB |
| Results .png | 107.56 KB |
paired-sample t-test
Hi,
your variable sheet is correct. However, you have to select "group" (pre post) as "Within Covariate" and NOT "Between factor". It is correct that you selected subj_ID as Within ID.
GraphVar will subsequently subtract the pre and post values per individual and performs a one-sample t-test agains zero (which is essentially a paired sample t-test). Therefore you will not have the possibility to show both groups (pre versus post) in the viewer but will only see one line (for your global clustering) that represents the difference of pre vs post.
All the best,
Johann
Follow-up question about interpretation
Thank you for your response.
Given that only one line is generated, if we find that there is a significant difference pre and post intervention, how would we interpret the direction of the finding? For example, if there is a significant difference in global clustering coefficient, how do we know if the global clustering coefficient is larger or smaller after the intervention?
Is the answer in the mat file (1 row x 26 columns) created at each threshold for a particular graph metric? We have 13 subjects with pre and post data. Does each column represent a subjects pre and post values? Further, how is this data organized? Are the first 13 columns all pre values and the last 13 columns all post values?
Thank you in advance.
interpretation
Hi and sorry for the very late reply,
GraphVar subtracts the first group from the second group (e.g. first group = pre, second group = post; post-pre = diff). Yes, the answer is in the mat file. Here the columns represent the subjects and this is ordered exactly as the subjects in your variable sheet. Again, I am sorry for the late reply!
Johann
No worries - that makes sense
No worries - that makes sense!
Thanks Johann!
Hello Johann,
Hello Johann,
I am following up on this. Is there a way to see the actual pre and post values and not just the difference between them?
Thanks in advance!
Raw values
Dear TimesNewRoman1,
when GraphVar does paired t-tests and similar linear models, the first step is to calculate the difference between the pre- and post-intervention values. As such, everything that is calculated is based on the difference. There are no statistics related to the actual pre-/post-intervention values produced in the code.
If you are interested in examining hypotheses in the data separately for each session, I would recommend that you create one workspace with the pre-, and one workspace with the post-intervention data. You can then repeat any hypothesis tests of interest in both workspaces separately. Of course, these tests are not orthogonal to the paired t-test, so I recommend adjusting the α-level accordingly.
Nevertheless, if you wish to inspect the values before differencing, please make a breakpoint in src/calc/graphvar_glm.m in line 501. The expressions Y_(WIND1, :, :)and Y_(WIND2, :, :) now yield the pre- and post-intervention values, respectively. Note that nuisance covariates have not yet been regressed out at this stage.
Please feel free to contact me if you have any further questions.
Best regards,
Lea Waller
Hello Lea,
Hello Lea,
Thank you for your response.
I would like to see the values before differencing. As you suggested, I entered a breakpoint in src/calc/graphvar_glm.m in line 501. I then ran the analysis, the one described above - with Group as my within covariate and Subj_id as my within_id. It did not run successfully; the progress bar go got stuck at the GLM phase. The workspace was paused in debugger mode.
This is what appears in the command window:
"Warning: File: CalcVars.m Line: 149 Column: 54
Regarding creating two separate workspaces, one for the pre and one for the post. Would this allow me to get the pre and post scores before differencing?
Thanks in advance for your help.
Hi,I follow up on this.I…
Hi,
I follow up on this.
I would like to have a paired sample t-test and I set up graphvar as suggested here, namely groups (pre post) as "within covariates" and subj_ID as "within id". However, all results of the comparison show a p-value = 1. Is there anything I did wrong? Could the problem be on the matrix construction?
Thank you in advance for your help
Alberto