Hi!
Thank you for such an elegant toolbox!
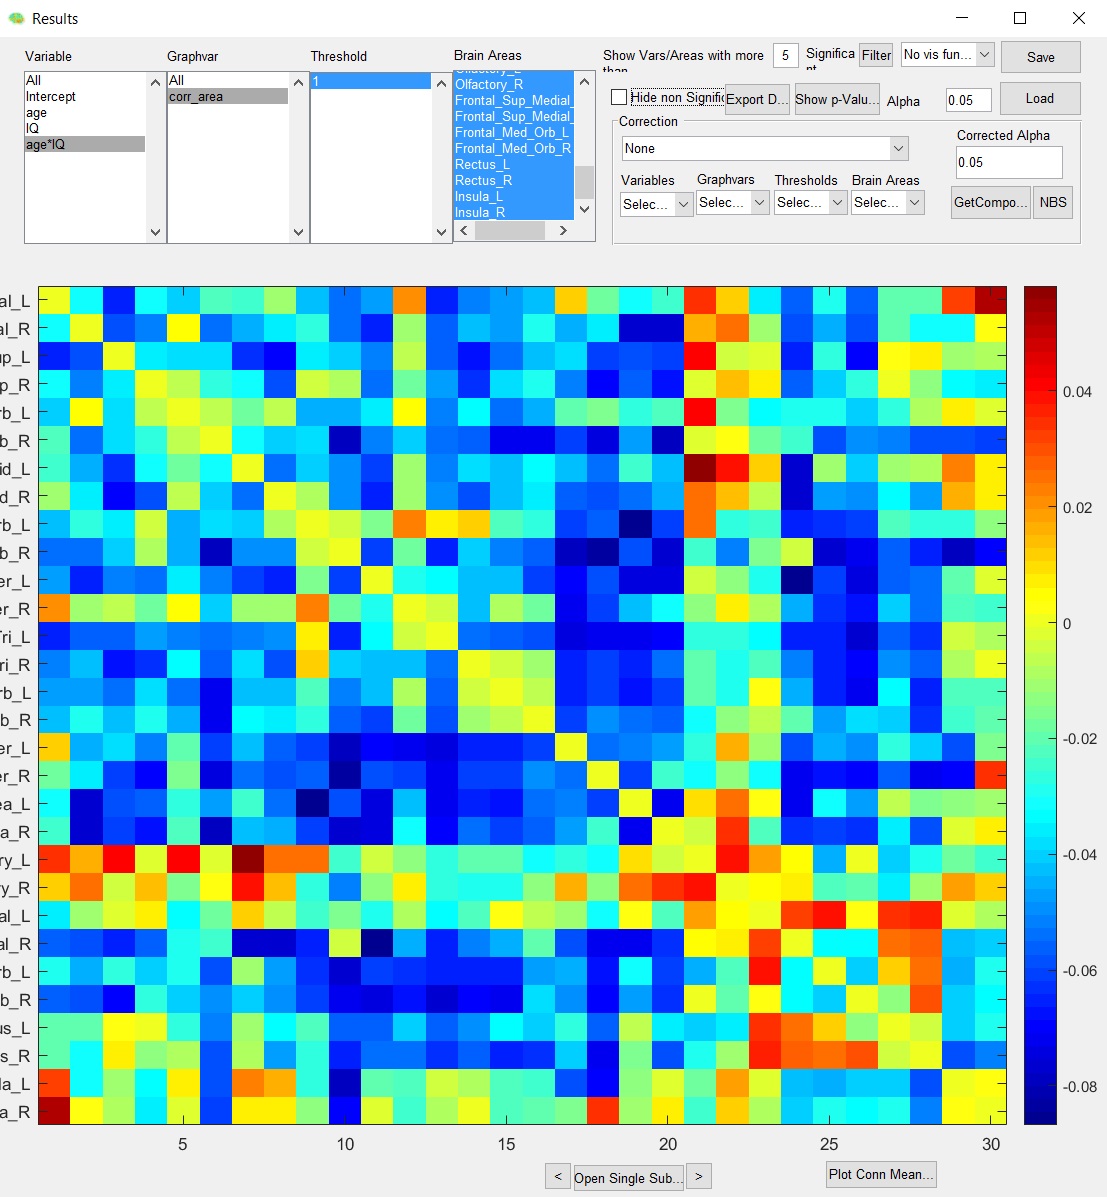
Unfortunately I’m experiencing some error when trying to proceed with third part of tutorial concerning Network Based Statistics (Raw Conn Matrix and Network Based Statistics). I’m setting ep everything as shown in tutorial pdf but some kind of error is happening (please see below) and results that I get are different from those presented in pdf. Here I am using matlab 2016b.
.jpg)
I tried running GraphVar on different machine and on different version of matlab (2015b) but same error occurs…
Seeing that error might be connected to parallel toolbox I tried running analyses with and without parallel workers specified but effect is the same in both situations.
Do you have any idea what might be going on here?
Bugfix continuous by continous interactions
thanks a lot for noticing the discrepancy between the tutorial and the actual output. After I put these slides together we did some small changes on the GLM model with respect to standardizing the regression weights (in the tutorial they are still unstandardized). These changes led to a bug in the case of continuous by continous interactions where in some models the direction of the effect was reversed. Importantly, this did not affect the p-values of the regressors.
We have uploaded a new version "GraphVar 1.02" with this bugfix! Now it should be similar to the tutorial (with standardized betas).
Thank you very much for swift reply and fast bug fixes!
Unfortunately I’m still getting very different results after correction using Random Networks/Groups(Bonferroni) option (tutorial example) with every recalculation of results. Although I’m not sure if this is some more general issue or has something to do with error that I mentioned earlier which is still occurring (my previous post). Do you have any insight into this problem?
more permutations needed
Hi,
as you are doing "permutation-testing" the p-values are directly derived from the null-distribution. The null-distribution can be "inaccurate" if there are not enough samples (i.e., permutations) and the outcome can differ. In this case with the data from the sample workspace it seems as 1000 permutations are not enough for reliable estimation of effects. Thus, you simply need more permutations to be more accurate.
This is mainly the reason why we put effort in implementing the permutations in C-code that ultimately allows for larg-scale and high-repetition permutation testing.
I just tried 20.000 permutations with the example from the tutorial and the outcome is nearly 100% identical when re-running the analysis multiple times (e.g. have a look at the non-parametric p-values via "Random Networks/Groups". It can be the case that single cells are at the border of signigicance with 0.051 and the next time 0.050 ... but this is how "random" permutations work.
FYI: the warnings can be ignored as they do not have any influence on the results.
Best,
Johann
one more concern
Hi,
Thank you for your response and highlighting some important aspects of permutation testing. The reason I was warried (being familiar with permutation testing) is that I thought that calculations should be close to the tutorial examples.
I have one more question regarding tutorial data/examples. I followed tutorial dealing with “Within design II (change of efficiency and behavior T1 T2)” but the result that I keep getting is again somehow reversed (maybe it is a problem connected to the previous one concerning reversed betas?):
Also I would greatly appreciate if you could confirm what is the correct method of entering within factor (within ID). Tutorial shows that “file identifier” has to be selected in the window appearing after loading variables from the file. But now there is no such option. So I managed to choose Subj ID (tutorial data) as “within ID” by entering into Scan ID into within covariance window. Is it the right way to do it now?
I would really appreciate clearing these issues.
Looks good!
Thank you!
Thank you very much for clarification!
As for tutorials and documentation I think that it would be indeed a good idea to update them as for now these are unfortunately somewhat misleading.
Thank you very much for your great work on this very handy toolbox!