Dear Johann,
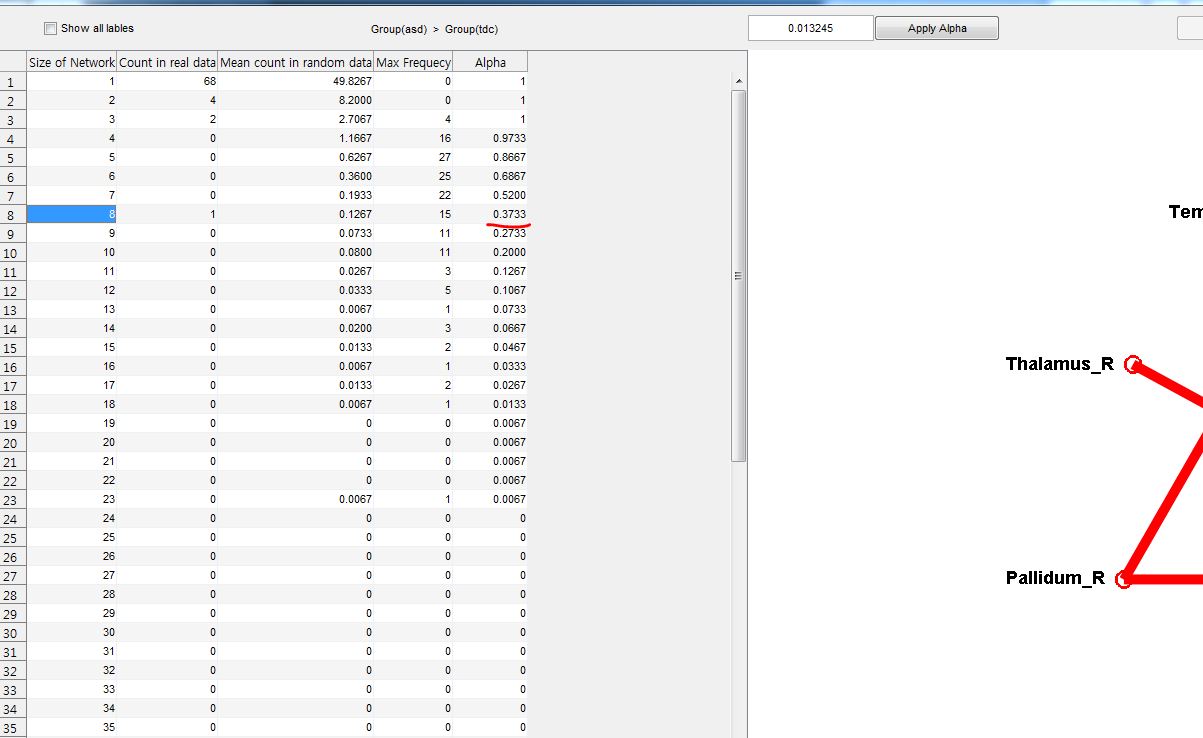
I got a new result according to your advice (150 times permutation tests). (please see the attached figure 1)
I corrected using Groups(FDR) thresholding and got those survived networks.
Could I regard that all the networks are statistically significant with multiple comparison correction?
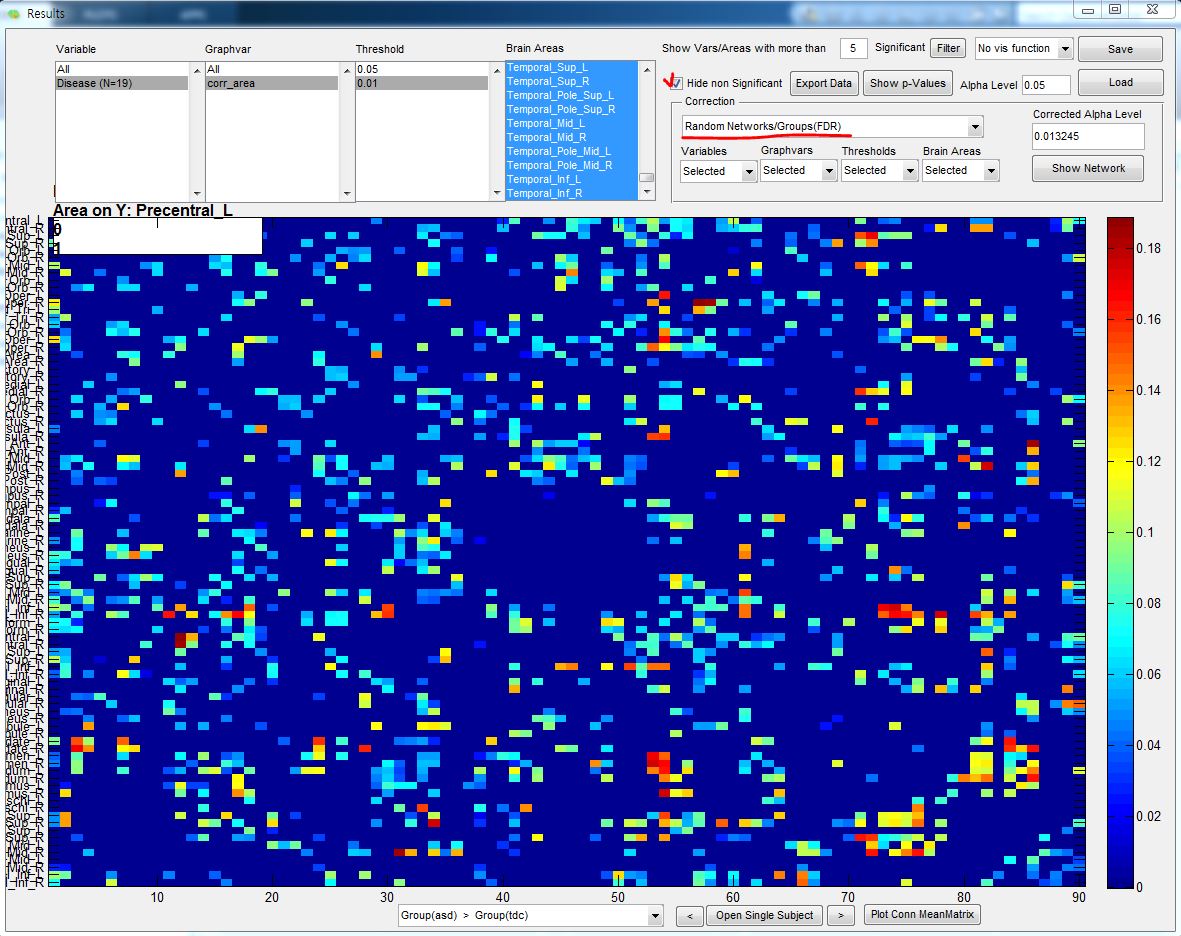
Actually, I did not find significant graph-components in Network Inspector panel (attached figure 2) but I think there are still significant networks as seen in the Results panel.
Really sorry for bothering you, I read the paper and manual several times but still I could not get it exactly.
Best regards,
Saske
| Attachment | Size |
|---|---|
| Figure 2.JPG | 86.96 KB |
| Figure 1.JPG | 234.91 KB |
Forums
Answer: Statistically significant networks
Hi Saske,
sorry for the confusion. I will try to clarify this in the following with some other remarks:
1. if you do significance based thresholding on the raw matrices (as you did with 0.05 and 0.01), I would generally advise to use non-parametric derived p-values (which you can obtain by computing the connectivity matrix based on your time courses and testing against random time series; this option is available when hitting the "create connectivity matrix" button in the "general settings panel"). You may run into problems with some reviewers when using the parametric p-values based on your original matrices. (If you have already done so - it´s alright!)
2. If you perform non-parametric permutation testing with your groups (two sample t-test) on the raw matrix, GraphVar will do two things:
-> 1. it will compute the t-test in a parametric fashion on each link (and derive a parametric p-value)
-> 2. it will compute the t-test in a non-parametric fashion on each link (using the group difference of the original and the permuted groups) and derives non-parametric p-values for each link
-> REMARK: if you only have 19 subject I would suggest more permutations e.g. 1000
3. These p-values can now be used for different purposes:
-> if you have an a-priori assumption of a group difference on a specific link or a specific set of links you can use the non-paramtric derived p-values to show that this difference is significant as compared to the permutation distribution of difference under the null hypothesis
-> you can subsequently correct these results by using e.g. Bonferroni or FDR correction (that is what you have done)
-> you can also do this with the parametric p-values (if you think that bootstrapping is not necessary)
4. However, this approach is not the same as performing network-based statistics:
-> in NBS you are looking for whether a Graph-Component with a certain size as a result of the respective analysis (for you two sample t-test) is non-random (it is compared against the amount and size of Graph-Components in “random” data). The size of a graph component is determined by connected significant links (this is the initial link threshold). The significance of a link is detemined by its parametric p-value (basically the p-value that you see in the results viewer if you do "Correction: None"). If you hide the non significant edges at an alpha (i.e., initial link threshold) of 0.05 you would see which edges (i.e., significant links) may contribute to your graph component (with this initial link threshold). You can play around to explore. Although, this is based on the parametric p-values, you could theoretically determine the initial link threshold for the graph component by using your approach (using a non-parametric FDR corrected p-value).
-> Now: if you use the threshold as derived by your FDR correction based on non-parametric testing (i.e., p=0.013) as an initial link threshold in NBS, it can very well be that this threshold results in bigger graph components in random data (i.e., more links surviving this threshold that are attached to one another) . This is what you see in your data: there are bigger graph components occuring more often in the random data with this threshold).
-> This means that the non-parametric derived FDR corrected alpha level for your entire matrix does not guarantee to detect a graph component related to your effect of interest (as this is technically a different approach that does not regard the occurence of maximum graph component size). However, we implemented to carry over the corrected alpha level (from the results panel) to the Network Inspector as a suggested alpha level as some people may want to use this approach.
5. In the end, the initial link threshold can also be chosen on other criteria. I would suggest (this is from the NBS manual): "experimenting with a range of thresholds. Sensitivity to the test statistic threshold may reveal useful information about the nature of the effect. Effects present only at relatively liberal thresholds (e.g. p < 0.05, where 14we have expressed the threshold as a p-value rather than a test statistic) are likely to be subtle yet topologically extended. Effects present at only conservative thresholds (e.g. p < 0.001) are likely to be characterised by strong, topologically focal differences. Effects present across a range of thresholds are likely to be characterised by a combination of both."
-> so try out 0.005 and 0.001 as initial link thresholds!
6. Theoretically, what you could alternatively do with your results as posted in the results-viewer (non-parametric derived FDR corrected alpha level for your entire matrix): export the results and let the BCT "get components" function run over the matrix (csv file RHO). This would tell you if there is a connected subnetwork within your data. BUT: this is not NBS and may tell you something different.
I hope this helps,
Johann
I appreciate for your kind details
Dear Johann,
I really appreciate for your kind and full detailed comments.
I already read your advice several times and got some simple and general questions.
1. The 'non-parametric derived p-value' which you mentioned 1st sentence in your reply means 'RandPValMatrix' in 'Raw Matix panel' ?
2. In case I just want to see the significance of specific link which I am interest in, could I decide the significances in 'Result viewer' using multiple comparison correction(e.g. In group comparison, use the Random Networks/Group(FDR)?
3. I am still confused about the meaning of Graph-Components. The documents said that Graph-Components are subnetworks in which all pairs of nodes which are connected by significant links. However there are still significant links in Result viewers. Could you explain the meaning of Graph-Components using some examples and difference between significant links(after FDR correction) in 'Result viewer' and Graph-Components.
I am happy to use your great and wonderful software and sorry for bothering you again.
Best regards,
Saske
Answers
Thank you so much
Dear Johann,
I really appreciate for your kind reply.
All the answer you replied are very helpful for me.
In addition, now I understand the meaning of graph-components after reading the NBS paper.
As I understood, making graph-components is another thresholding method using NBS with parametric p-value to determine significances between nodes(brain areas).
So the paper compared conventional thresholding FDR or FWE etc.
Am I correct?
Always thank you for help.
Best regards,
Sakse