Dear experts,
I run group comparison via GraphVar and got some results.
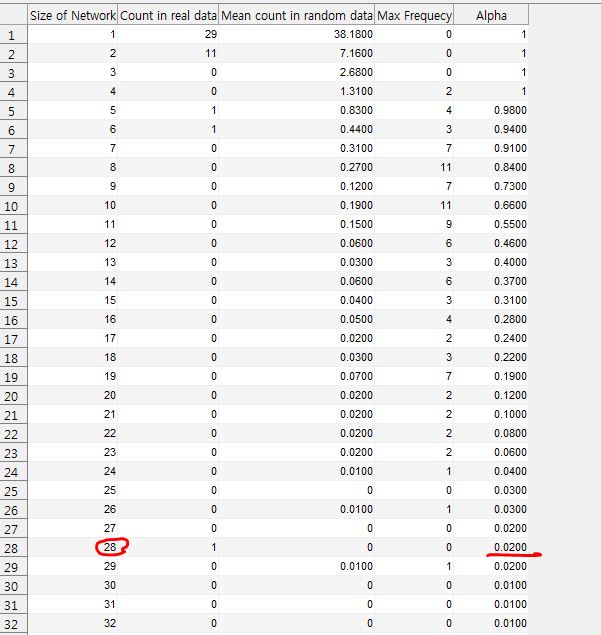
As you see the attached figure, the checked network is significant?
I wonder if only networks which have alpha values below 0.05 showed significant differences or not.
Best regards,
Saske
| Attachment | Size |
|---|---|
| 1.JPG | 66.79 KB |
Forums
Hi Saske,
Hi Saske,
according to the output table you identified a significant graph component with size 28. Indeed, only graph components with an alpha below 0.05 would be considered significant. However, this significance level strongly depends on the initial link threshold (i.e., primary threshold) that you would have to define a-priori (this is the box in the menu bar in the network inspector). Depending on your initial link threshold you may receive different sizes of graph components. Also keep in mind that you will receive a more reilable estimate if you compute a high number of random networks/data.
This is a nice explanation for the choice of the initial link threshold (from the NBS manual, Zalesky et al.):
"Choosing the test statistic threshold (i.e. primary threshold) is ultimately a matter of experimentation. Fortunately, it is the only parameter associated with the NBS that requires tuning. The arbitrariness of this parameter has been leveled as a criticism of the NBS. The basis of the criticism is that statistical inference with the NBS can be contingent on the choice of test statistic threshold. New networks can appear with a change in threshold, while significant networks can contract/expand to encompass fewer/more connections, or lose their significance all together. A rebuttal to this criticism is that control of the FWER is guaranteed irrespective of the threshold choice. The choice of threshold only affects the sensitivity of the method. We recommend experimenting with a range of thresholds. Sensitivity to the test statistic threshold may reveal useful information about the nature of the effect. Effects present only at relatively liberal thresholds (e.g. p < 0.05, where 14we have expressed the threshold as a p-value rather than a test statistic) are likely to be subtle yet topologically extended. Effects present at only conservative thresholds (e.g. p < 0.001) are likely to be characterised by strong, topologically focal differences. Effects present across a range of thresholds are likely to be characterised by a combination of both."
Best,
Johann
Thank you so much
Dear Jahann,
I really appreciate for your quick reply.
I should check what you mentioned.
Best,
Saske