Hi, I have some questions about the results from an NBS analysis on raw connectivity matrices. For questions, we could look to the example NBS table in the manual (attached).
1. Could you expland on exactly how (i.e., equation or formula) the alpha value in the 5th column is calculated? I'm having trouble figuring this out from the NBS papers. e.g., is the alpha derivable from the other columns in the network inspector table?
2. When we see cases where a component of certain size is observed in the real data, but then there are counts of 0 in the random data or max frequencies of 0 for a respective component size, does this generally indicate that we didn't run enough random permutations (of either correlations or group shufflings)?
3. Related to #2, is the choice of number of permutations more a function of number of subjects, number of nodes, how stringent we want to test for the graph component threshold, or all of the above? I'm just wondering if there's a way to estimate what a sufficient number of permutations is for correlations or group comparisons in different scenarios of N ROIs and N subjects.
4. Your links in the example are all correlated with age in the negative direction, but you could just as well have positive and negative links as part of a single identified component right?
thanks!
| Attachment | Size |
|---|---|
| nbs_question_manual_ref.jpg | 255.96 KB |
NBS questions on calculation and interpretation
Hi,
to your questions:
1. this is described in more detail with an example in the GraphVar_Manual.pdf (starting page 25):
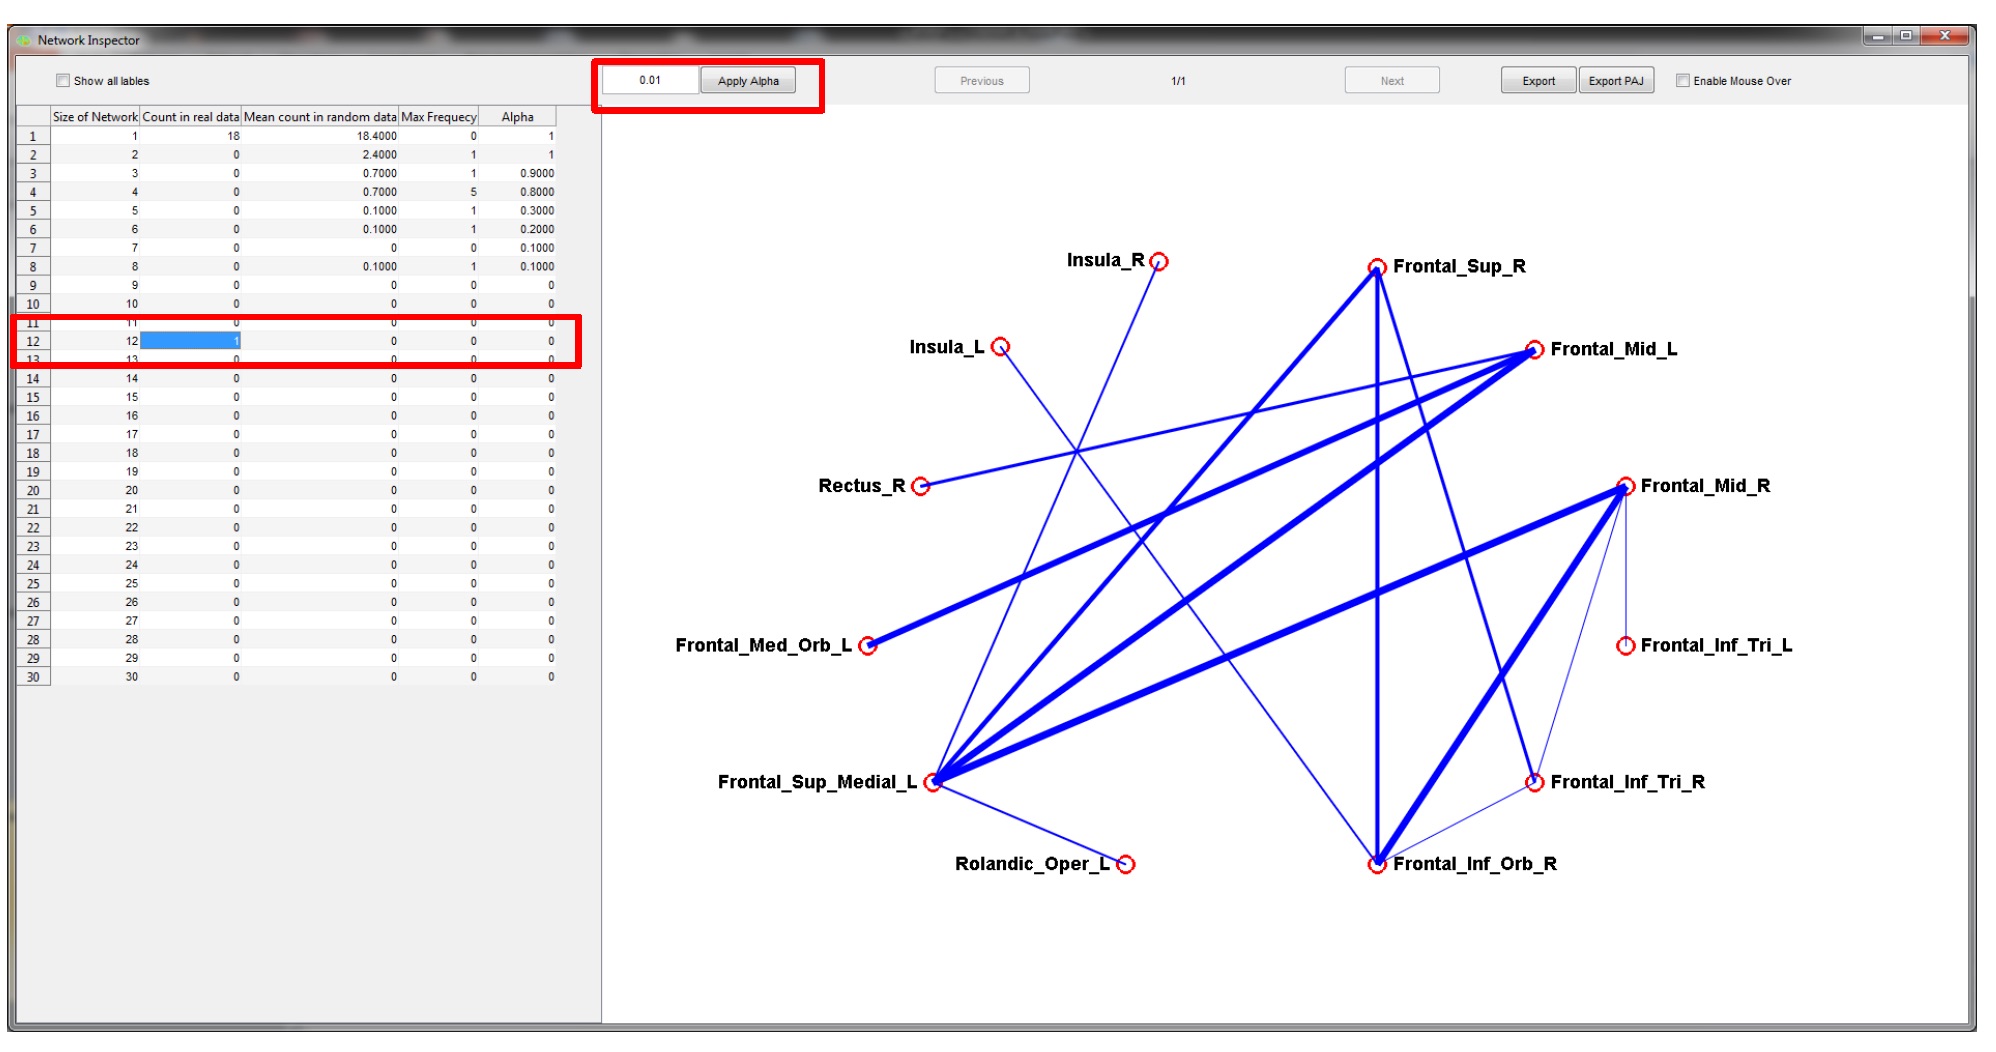
"The program output contains a table with five columns. The first column lists different Graph-Component sizes (in participating nodes). Graph-Components of size one are disconnected nodes (disconnected through the initial Alpha; see “Alpha input-box”). The second column lists the frequency of occurrences for Graph-Components in the real data of the given size in the first column. For example, in the real data a Graph-Component of size 5 occurred one time. The third column lists the mean count of graph-Components in the random data of size as given in column one. For example, in the 100 comparisons of connectivity differences in the entire network using random permuted groups, a Graph-Component with the size 5 occurred 16 times (i.e., mean count in random data of 0.16). The forth column lists the number of times, out of the 100 comparisons on random data, that the maximum size of a Graph-Component in the network was as given by column 1. For example, in 12 of the 100 “random” comparisons, the largest Graph-Component in the entire network contained exactly 5 nodes. Therefore, if the Graph-Component size listed in column one is used as the minimum Graph-Component size threshold, then column five estimates the probability of a false detection occurring in the “real” network (in this example the Graph-Component of size 5 in the real data would not be significant)."
It may also be important to note that these are cummulated probabilities (the procedure is relatively similar to afni´s AlphaSim).
Alternatively, also see the NBS manual (from Zalesky which is written quite understandabe and also provides some formulas).
2. No, this doesn´t generally indicate that you did not run enough permuations but rather speaks for a strong effect in your data
3. In general, the more permutations you compute the more accurate your graph component p-value will be (I would not consider this "more stringent" testing). I don´t know any rule of thumb that takes into account how many subjects or nodes you have but there are two factors that come into my mind right now that will have an influence on the results: first, the size of the graph component will crucially depend on the initial link threshold, whereas the significance of this threshold will also depend on the number of subjects (i.e., even for a small effect, the p-value will naturally become smaller the more subjects you have in your sample). Second, the size of the graph component will also crucially depend on the number of nodes in the network. However, I belive this is relatively independent of the number of permutations you will have to perform for deriving graph components p-values. Please also refer to the NBS manual for an explanation of how the test-statistic threshold can be chosen.
4.Yes, this is possible.
Best,
Johann