Hello
When I try to run the "Network Calculations" section of GraphVar by clicking on the "Calculate variables and export" button, it seems to do the calculating just fine, but then gives this error (copied below) when it goes to export. I haven't had any problems with the Statistics or correlations portion on this dataset, just this section for basic network calculations. It doesn't seem to matter what metric I'm using.
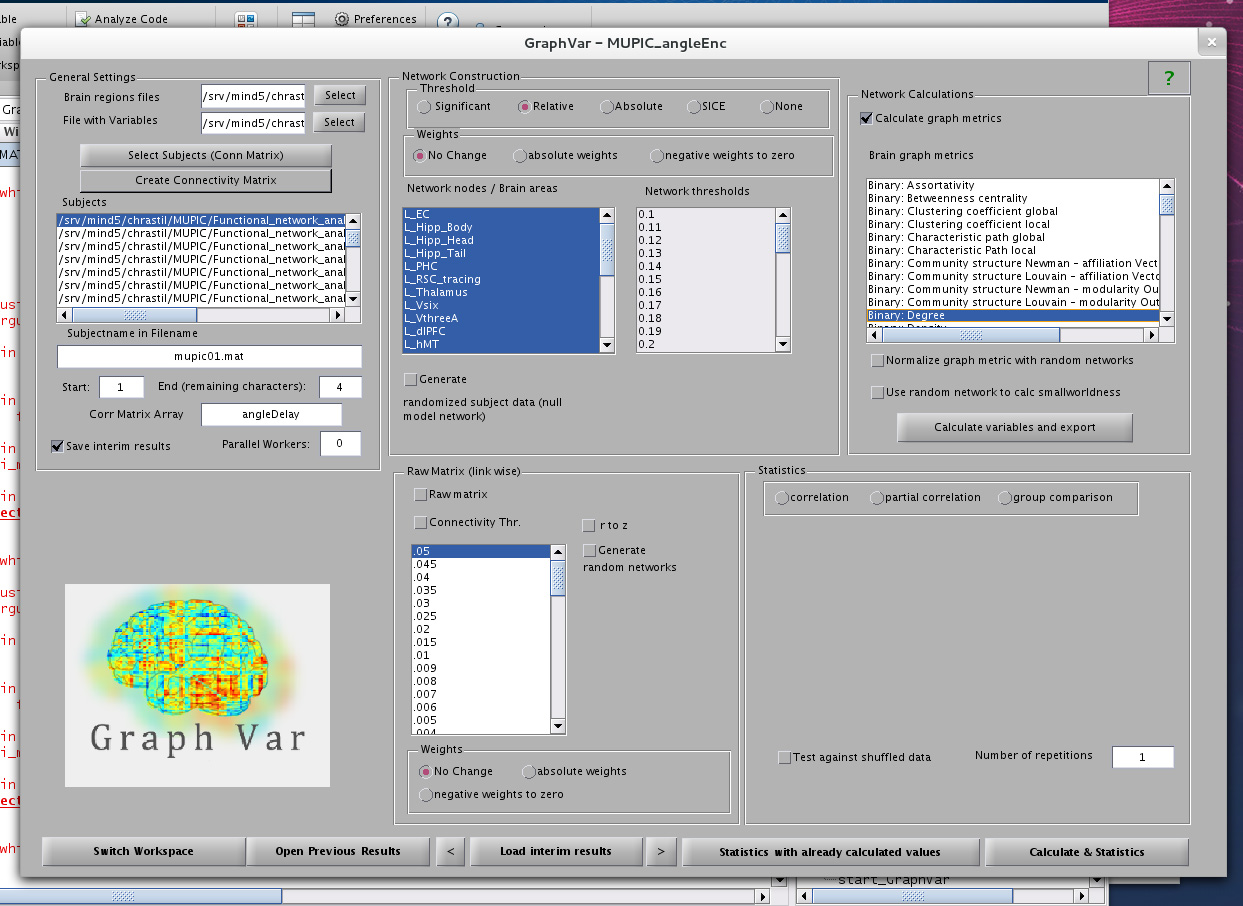
I've included a screenshot of the things that I've selected in the GUI.
Thanks!
Error using reshape
Size arguments must be real integers.
Error in GraphVar_CalcExport_Callback (line 69)
tes = flipud(rot90(reshape(Shape,90,length(Shape)/90),1));
Error in gui_mainfcn (line 96)
feval(varargin{:});
Error in GraphVar (line 40)
gui_mainfcn(gui_State, varargin{:});
Error in
@(hObject,eventdata)GraphVar('GraphVar_CalcExport_Callback',hObject,eventdata,guidata(hObject))
Error while evaluating uicontrol Callback
| Attachment | Size |
|---|---|
| Screenshot.jpg | 336.85 KB |
Export
Hi,
thanks for pointing to this issue! We are very sorry but this might be an overseen bug. This error occurs as for export of some metrics (e.g. betweenness centrality) we must reshape the output. This particular export function expects that you have 90 brain regions. To make it work for your purpose please change line 69 in src\gui\GraphVar\GraphVar_CalcExport_Callback.m This line must reflect the numer of selected nodes in your network (i.e., number of selected nodes in the "Network nodes/Brain areas" field).
original: tes = flipud(rot90(reshape(Shape,90,length(Shape)/90),1));
modifiy: tes = flipud(rot90(reshape(Shape,#NODES,length(Shape)/#NODES),1));
Please let me know if this works for you.
Best,
Johann
It worked
Thanks, that worked. So I will just manually change it to whatever the size of my network is. I now get the txt files with all of the different thresholds for the variables I'm interested in.
As a follow up, I want to test the significance of this network for one of the graph metrics, not by doing a correlation with one of my variables or by grouping subjects by variable, but just against a random networks. I do this by going to the Statistics box, clicking "group comparison", and then the check box for "Test against random network", correct? It's still highlighting one of the variables, so I'm not sure if it's using that variable as a way to split the groups.
Thanks!
follow up
Hi,
I am afraid I do not fully comprehend what you want to do (as you are talking about "test the significance of this network" - normally you would have one network per subject... so multiple networks and would do some kind of inference statistic with e.g. clinical data). In case you mean that you want to get a non-parametric p-value (i.e. testing against random networks) for each subject with respect to a specific graph measure (e.g. to test for each subject separately if the efficiency in his respective network would be higher as compared to the efficiency in random networks), I would do the following (this would be some kind of bootstrapping approach and is a "work around" in GraphVar):
1. generate some random networks for each subject (e.g. 100 -1000) with the "Raw Matrix (link wise)" function in GraphVar (here you may use "null_modell_und_sign" for better subject specific networks). For GraphVar to generate and save those random networks, you will have to perform a "fake" statistical analysis (e.g. correlation; so include a variable sheet with your subject ID´s and some data) and also select "Test against random networks (raw matrix) in the "Statistics" panel. Subsequently click "Calculate&Statistics".
2. if this calculation is finished and you are prompted to the "Results Viewer", graphVar will have saved the random subject specific networks in your interim results folder (Your Workspace/results/#some number) . Here you find a subfolder called "RandomizedShuffel" (sorry for the typo). In this folder you will find the random networks for each subject numbered respectively.
3. Load all these random networks into Graphvar with "Select Subjects (Conn Matrix)" + select the "CorrMatrix" array. Do not forget to highlight the original subject name in the file name (should correspond to your subjects name in the variable sheet). Now perform the same graph analysis (i.e., same selected nodes and same selected thresholds) for the graph metric you desire (e.g. efficiency). To get these efficiency values for each of the subject specific random networks click on "Calculate variables and export". You will get the xlsx/csv sheet with the graph metric for each subject specific random network for the desired thresholds.
4. If you have exported the respective graph metric (e.g. efficiency) for the original subject networks beforehand, you can subsequently determine on which position (i.e., percentile) in the distribution of your random network derived graph metric the original metric is located (e.g. you have 999 random efficiencies for a subject and your original efficiency is the fifth highest of all these efficiencies you would have a p of 0.005 (i.e., 5/1000). You will have to do this calculation outside of GraphVar.
5. This would be a bootstrapping approach to determine if a subject specific graph metric would be significanlty different (in this case higher) as compared to efficiencies derived by its subject specific random networks.
I hope this is what you have been looking for.
Best,
Johann
Re:follow up
Yes, that's what I was looking for, thanks. I'll give that a try and let you know if I run into any problems.
Liz