Others

How to remove the edge of a cluster in the BrainNet Viewer
Submitted by puyunfashi on
Forums

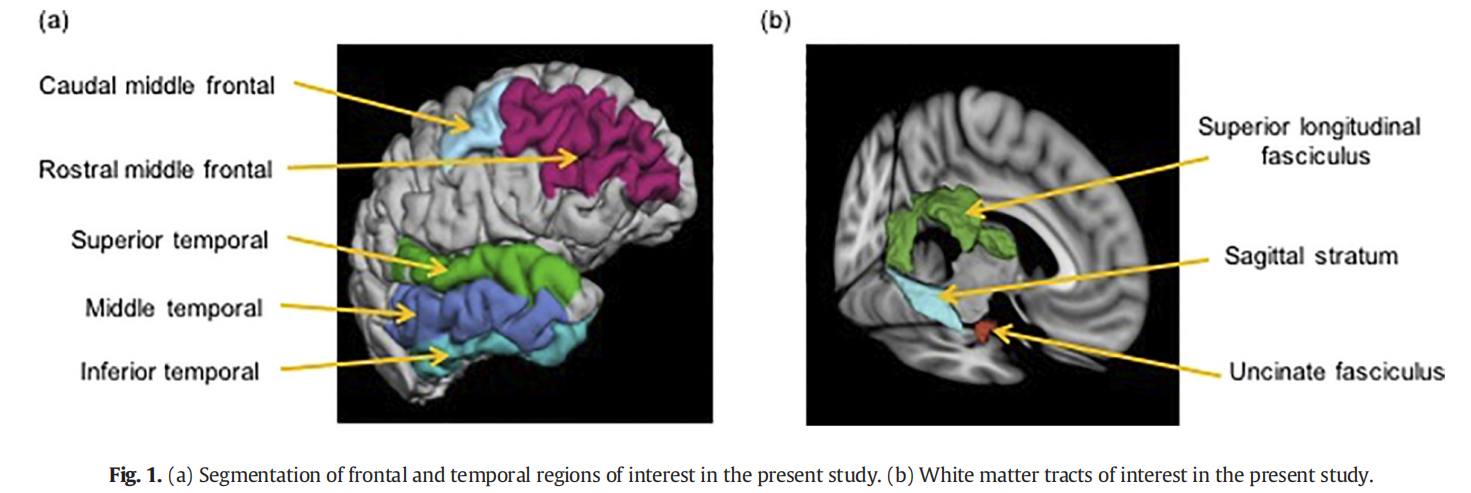
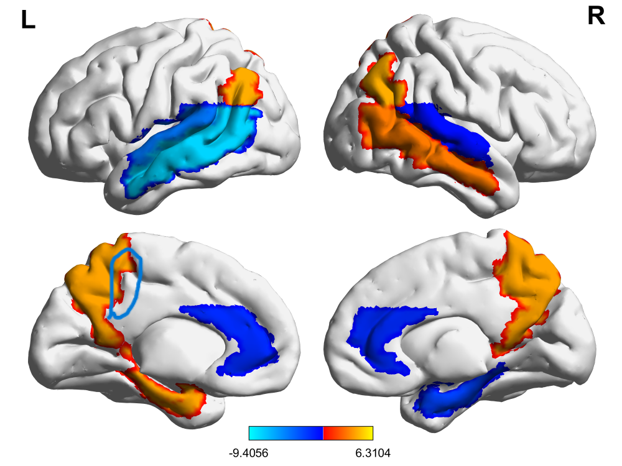
I found the BrainNet Viewer somtimes renders an odd "edge" of a cluster, as shown in the above picture. Especially when you wish to render a region of interest that consists of the same value for all voxels. You may change the default setting to remove it.

In the setting window, got to "Global" and change the "shading properties" as "Flat".

REST GCA multivariate coefficient results

Submitted by zuolonglotu@gm… on
Forums

Dear experts,

I would like to know how to understand and use the results of  multivariate coefficient of GCA. I choose the ROI mode.

There are two kinds of .txt in the result folder

1) GCA_sub_*_order1. txt, what is the means of matrix in the text?what is the mean of every columns and rows?

2) ROI_GCA_sub_*.txt, what is the means of matrix in the text?wha is the mean of every columns and rows?

3) How to do statistic analysis with these .txts?

Thanks a lot!

Best wishes,

Lotus


MATLAB code to read 4D rsfMRI

Submitted by FaezeVedaei on
Forums

Hi

I am just trying to write my own MATLAB code to do some part of preprocessing. I need to conver the list of 4D rsfMRI data to 3D. In fact I have 5 subject data in the list and each one has 450 timepoints rsfMRI. I want MATLAB read each 450 timepoints and average them together and give a 3D data for each subject.

Can you please help me to prepare this part? I really appreciate that.

Regards

Faeze

paired t-test

Submitted by DoBOLD on
Forums

Dear all,

I uniformly parcellate the GM binary mask of size 61*73*61 into 6k parcels. Each parcel is a 2*2*2 cube.

So my feature is built on parcel-level for each subject.

Can I apply the paired t-test statistical pipeline in the DPABI software?

Or do I need to get back to voxel-level feature in order to use this pipeline?

Thanks!