Hello, Prof. Yan~!
Previously, I performed correalation analysis using 'statistical analysis menu' in 'DPABI' to calculated R maps(in this case, I calculated voxelwise R maps between fALFF maps and clinical measures).
Now I am trying to perform correlation analysis using 'statistical analysis menu' in 'DPABINet' to calculate R matrix(containing r-value matrix with clinical measures, ex. 160x160 matrix) associated with clinical measures.
Therefore, this time, I try to do correlation analysis in edge level, not voxel-level(I try to perform NBS later).
After the correlation analysis, the outcome files are two: R, R_Cohen_f2(both matlab data).
but I felt strange about the contents of R(matlab data): NetworkMatrix(160x160), StatOpt(TestFlag:'T')
I thought that the NetworkMatrix should indicate 'Correlation values(Range: -1~+1)', but the results ranges from -3.XX ~ +3.XX(similar with t-stat).
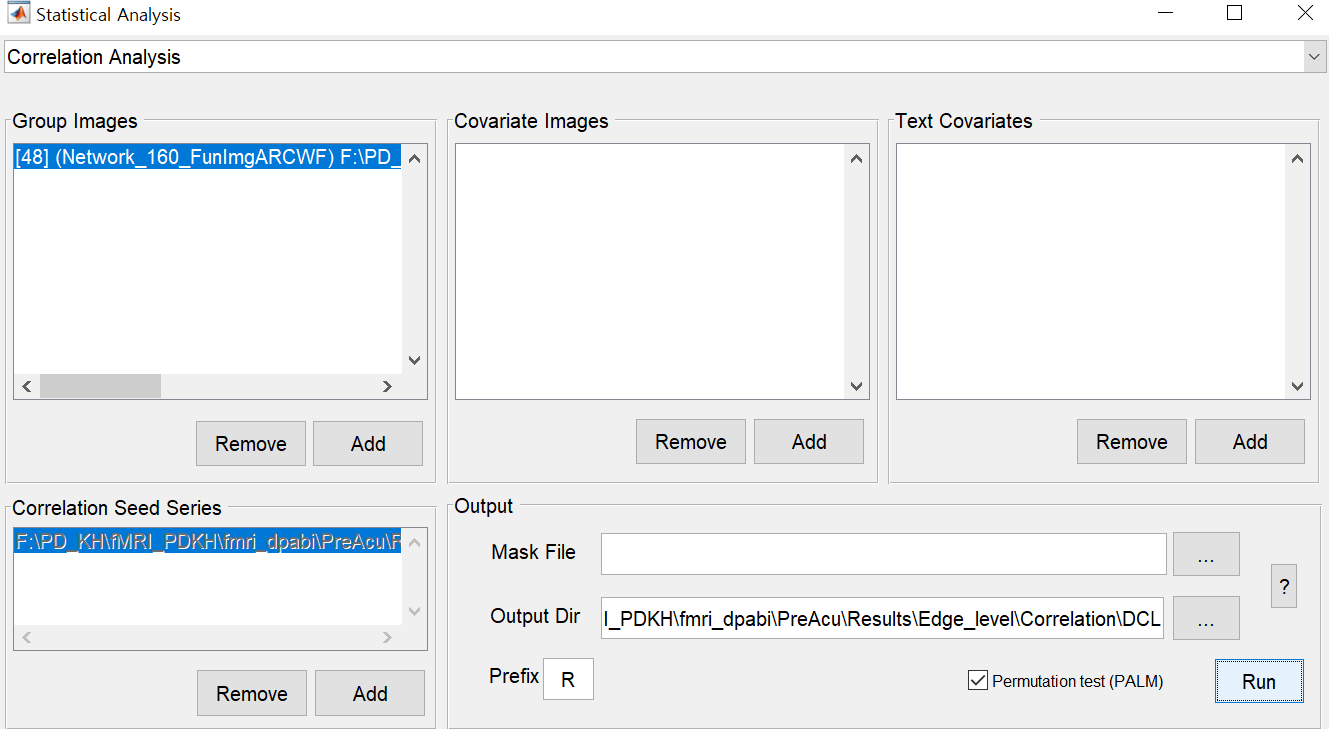
but I definitely performed 'correlation analysis'('Group images': patient's 160x160 matrix, 'Correlation seed series': clinical measures of the group, below image).
In this case, I wonder if the results of the analysis is appropriate. and How I interpret the results of correlation analysis?
I look forward to hearing from your opinion. Thank you.
| Attachment | Size |
|---|---|
| 캡처.PNG | 43.38 KB |
I cannot reproduce "StatOpt
I cannot reproduce "StatOpt(TestFlag:'T')".
Mine is R.