Hello everyone,
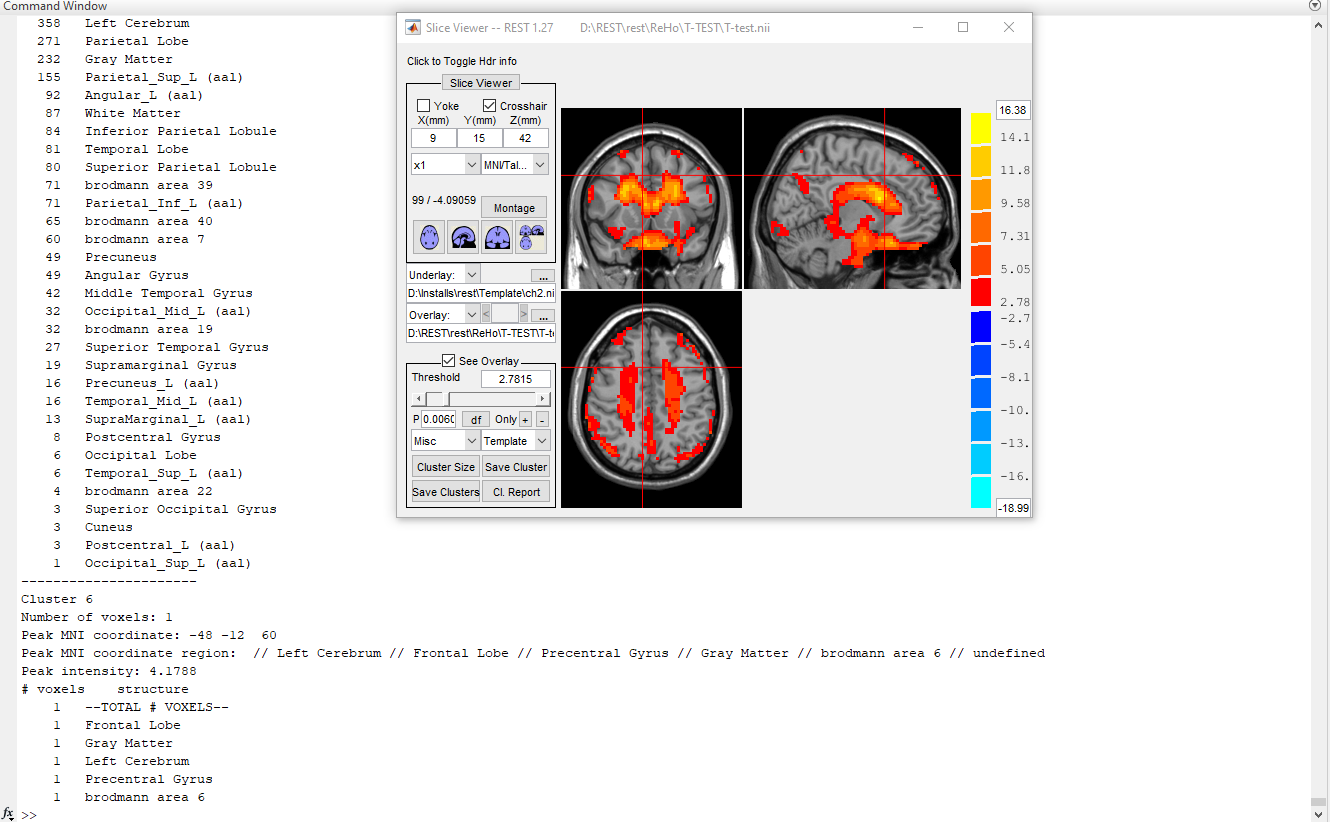
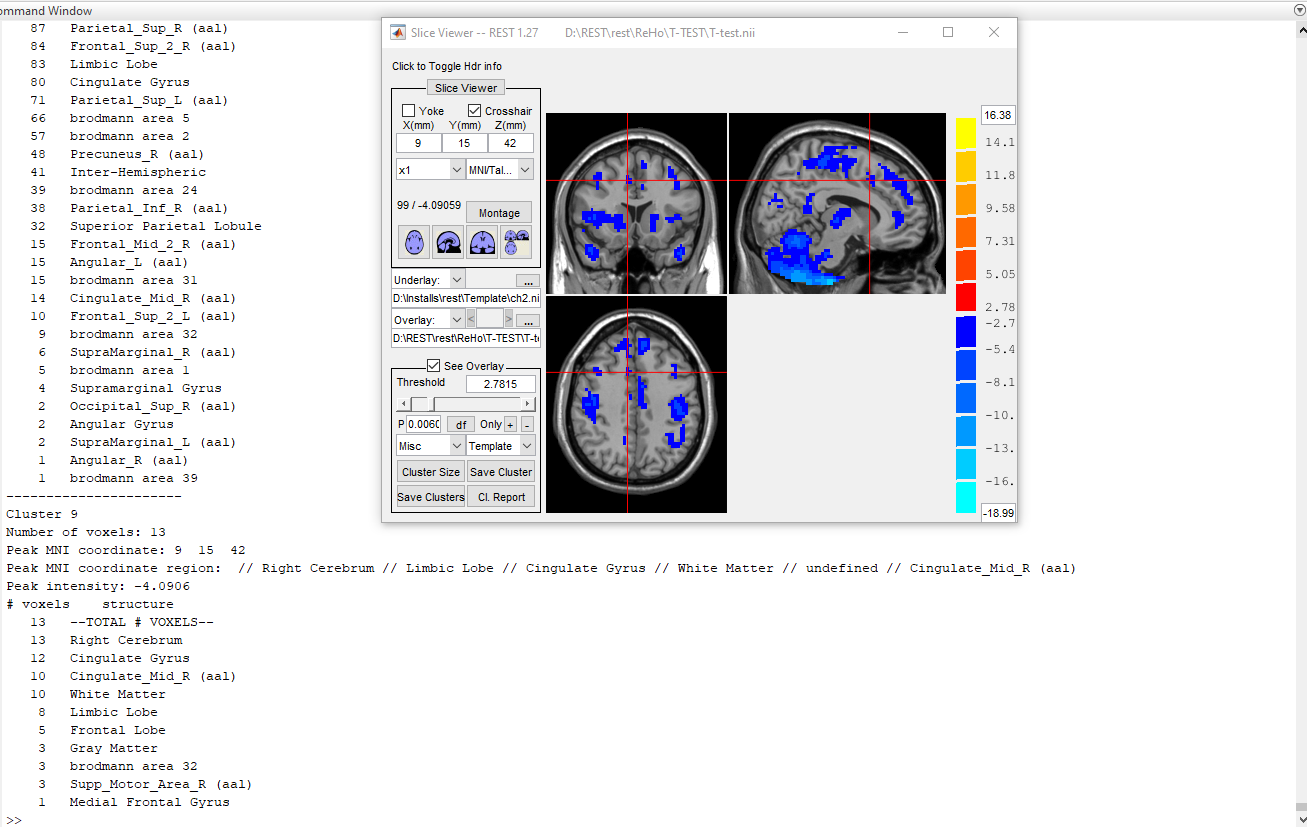
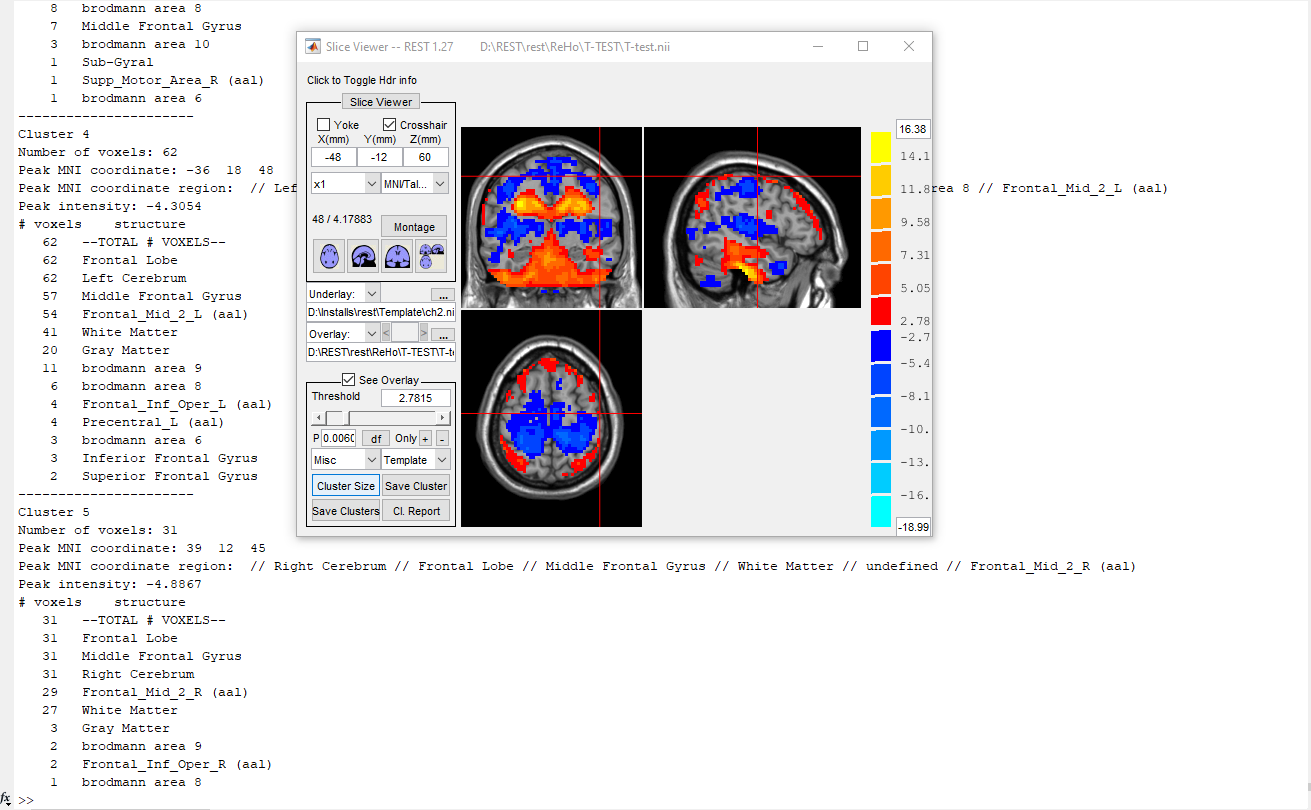
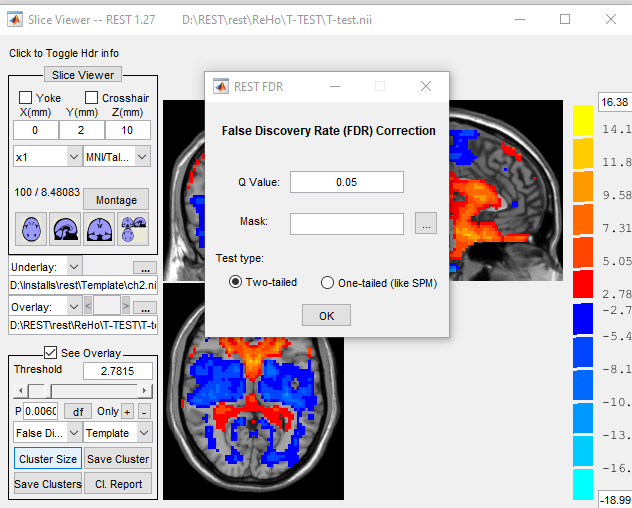
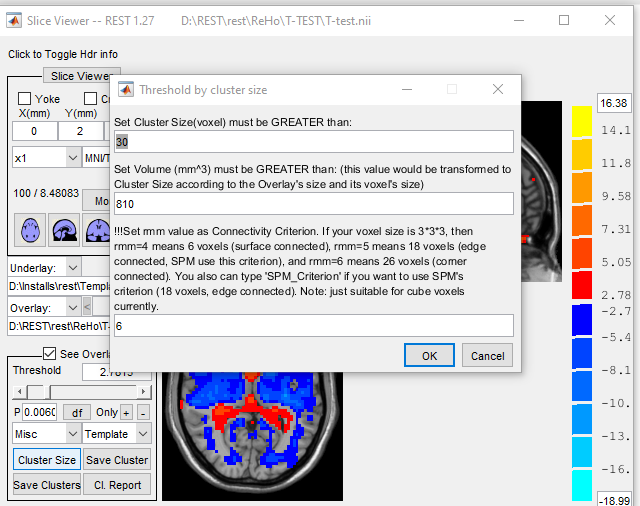
I have three groups in my ReHo analysis. I utilized RESTplus for preprocessing. Now, as I prepare to commence the statistical analysis, I encounter a question: When I input the two-sample t-test ReHo map or ANOVA ReHo map into the viewer section, the statistical map is corrected for multiple comparisons to a significant level of P<0.05 by combining the individual voxel P values <0.001 with a cluster size >810 mm3. However, the cluster report only displays negative values. Yet, upon clicking both the positive and negative values, the cluster report appears markedly different. Additionally, the total voxel number in some clusters is lower than 30,Although I had chosen the number 30 as the minimum cluster size .
The below image is ReHo two sample t-test .
Could you please assist me in resolving this issue?
Co